The interaction between murine melanoma and the immune system reveals that prolonged responses predispose for autoimmunity
- PMID: 23524369
- PMCID: PMC3601172
- DOI: 10.4161/onci.23036
The interaction between murine melanoma and the immune system reveals that prolonged responses predispose for autoimmunity
Abstract
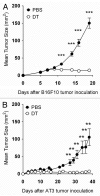
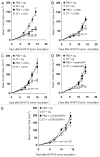
An assessment of antitumor immunity versus autoimmunity as provoked by the specific depletion of Foxp3+ Tregs is now possible with the development of Foxp3-diphtheria toxin receptor-like transgenic mouse models. We have used the poorly immunogenic B16F10 melanoma model to characterize a very heterogeneous antitumor effect of the immune response induced by Treg depletion. Depletion and neutralization studies demonstrated the importance of host T cells and interferon γ (IFNγ) in mediating the antitumor response developing in Treg-depleted mice. Such a response correlated with increased proliferation of granzyme B- and IFNγ-producing T cells in the tumor. Furthermore, enhanced antitumor immunity modulated the expression of MHC Class I molecules by B16F10 melanoma cells in Treg-depleted mice. Since Foxp3+ Treg depletion induced a significantly heterogeneous antitumor response, for the first time we were able to assess antitumor immunity and autoimmunity across different groups of responding mice. Strikingly, the duration of the tumor-immune system interaction provoked in individual Treg-depleted mice positively correlated with their propensity to develop vitiligo. A rapid complete tumor rejection was not associated with the development of autoimmunity, however, a proportion of mice that suppressed, but did not effectively clear, B16F10 melanoma did develop vitiligo. The significant implication is that approaches that combine with Treg depletion to rapidly reject tumors may also diminish autoimmune toxicities.
Keywords: Treg; autoimmunity; effector; immune modulation; suppression; tumor immunity.
Figures


Similar articles
-
Selective depletion of Foxp3+ regulatory T cells improves effective therapeutic vaccination against established melanoma.Cancer Res. 2010 Oct 15;70(20):7788-99. doi: 10.1158/0008-5472.CAN-10-1736. Epub 2010 Oct 5. Cancer Res. 2010. PMID: 20924102
-
Glucocorticoid-induced TNF receptor family related gene activation overcomes tolerance/ignorance to melanoma differentiation antigens and enhances antitumor immunity.J Immunol. 2006 Jun 1;176(11):6434-42. doi: 10.4049/jimmunol.176.11.6434. J Immunol. 2006. PMID: 16709800
-
Few Foxp3⁺ regulatory T cells are sufficient to protect adult mice from lethal autoimmunity.Eur J Immunol. 2014 Oct;44(10):2990-3002. doi: 10.1002/eji.201344315. Epub 2014 Aug 11. Eur J Immunol. 2014. PMID: 25042334
-
Treg Fragility: A Prerequisite for Effective Antitumor Immunity?Cancer Immunol Res. 2018 Aug;6(8):882-887. doi: 10.1158/2326-6066.CIR-18-0066. Cancer Immunol Res. 2018. PMID: 30068755 Free PMC article. Review.
-
Immunity to melanoma: unraveling the relation of tumor immunity and autoimmunity.Oncogene. 2003 May 19;22(20):3180-7. doi: 10.1038/sj.onc.1206462. Oncogene. 2003. PMID: 12789294 Review.
Cited by
-
The Effects of Mesenchymal Stem Cells on Antimelanoma Immunity Depend on the Timing of Their Administration.Stem Cells Int. 2020 Jul 10;2020:8842659. doi: 10.1155/2020/8842659. eCollection 2020. Stem Cells Int. 2020. PMID: 32695181 Free PMC article.
-
Trial Watch: Anticancer radioimmunotherapy.Oncoimmunology. 2013 Sep 1;2(9):e25595. doi: 10.4161/onci.25595. Epub 2013 Jul 3. Oncoimmunology. 2013. PMID: 24319634 Free PMC article. Review.
-
Improved mouse models to assess tumour immunity and irAEs after combination cancer immunotherapies.Clin Transl Immunology. 2014 Aug 1;3(8):e22. doi: 10.1038/cti.2014.18. eCollection 2014 Aug. Clin Transl Immunology. 2014. PMID: 25505970 Free PMC article. Review.
-
Identification of a group of 9-amino-acridines that selectively downregulate regulatory T cell functions through FoxP3.iScience. 2025 Jan 31;28(3):111931. doi: 10.1016/j.isci.2025.111931. eCollection 2025 Mar 21. iScience. 2025. PMID: 40034859 Free PMC article.
-
Methylcholanthrene-Induced Sarcomas Develop Independently from NOX2-Derived ROS.PLoS One. 2015 Jun 15;10(6):e0129786. doi: 10.1371/journal.pone.0129786. eCollection 2015. PLoS One. 2015. PMID: 26076008 Free PMC article.
References
-
- Lesokhin AM, Hohl TM, Kitano S, Cortez C, Hirschhorn-Cymerman D, Avogadri F, et al. Monocytic CCR2(+) myeloid-derived suppressor cells promote immune escape by limiting activated CD8 T-cell infiltration into the tumor microenvironment. Cancer Res. 2012;72:876–86. doi: 10.1158/0008-5472.CAN-11-1792. - DOI - PMC - PubMed
Publication types
LinkOut - more resources
Full Text Sources
Other Literature Sources
Research Materials
