

Marked expansion of exocrine and endocrine pancreas with incretin therapy in humans with increased exocrine pancreas dysplasia and the potential for glucagon-producing neuroendocrine tumors
- PMID: 23524641
- PMCID: PMC3712065
- DOI: 10.2337/db12-1686
Marked expansion of exocrine and endocrine pancreas with incretin therapy in humans with increased exocrine pancreas dysplasia and the potential for glucagon-producing neuroendocrine tumors
Abstract
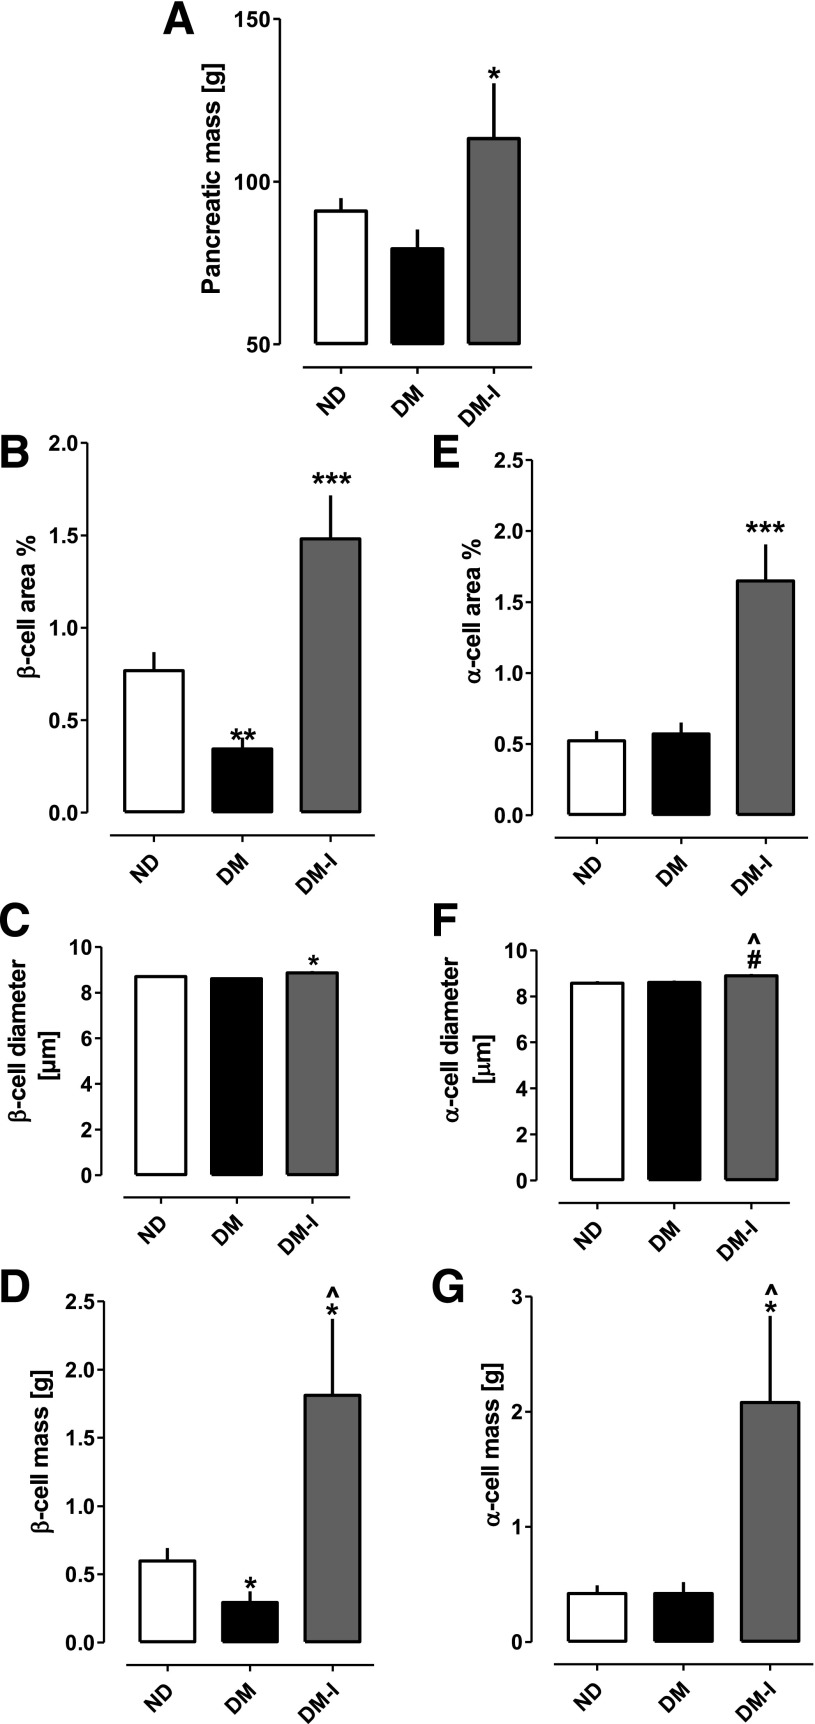
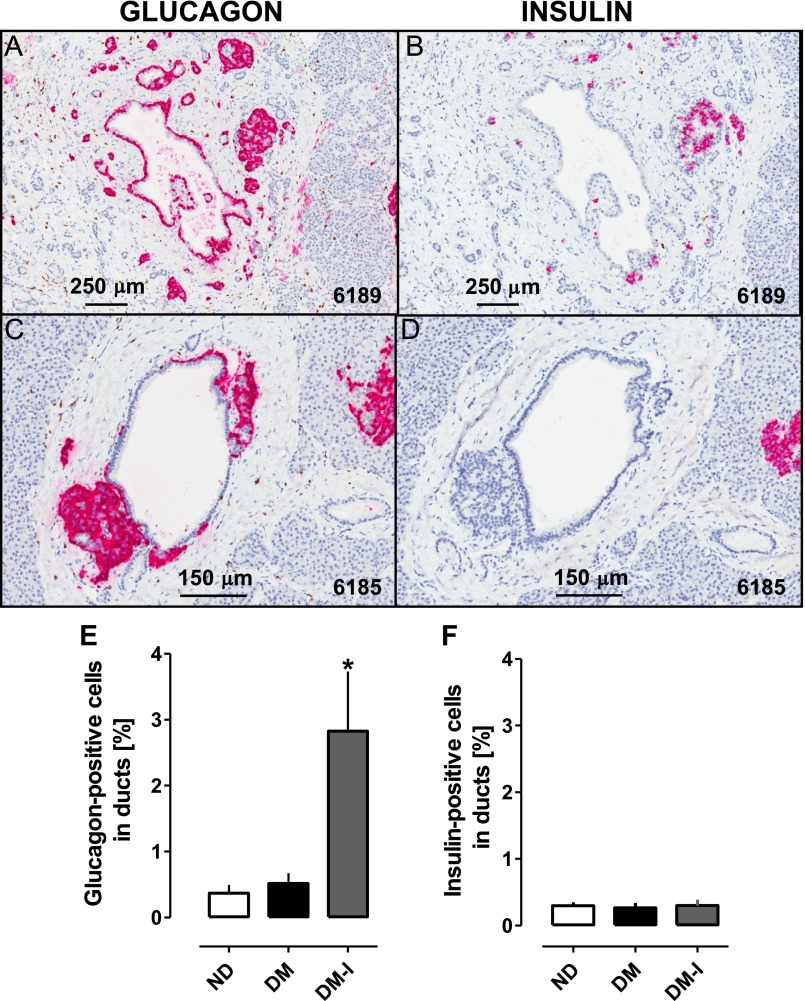
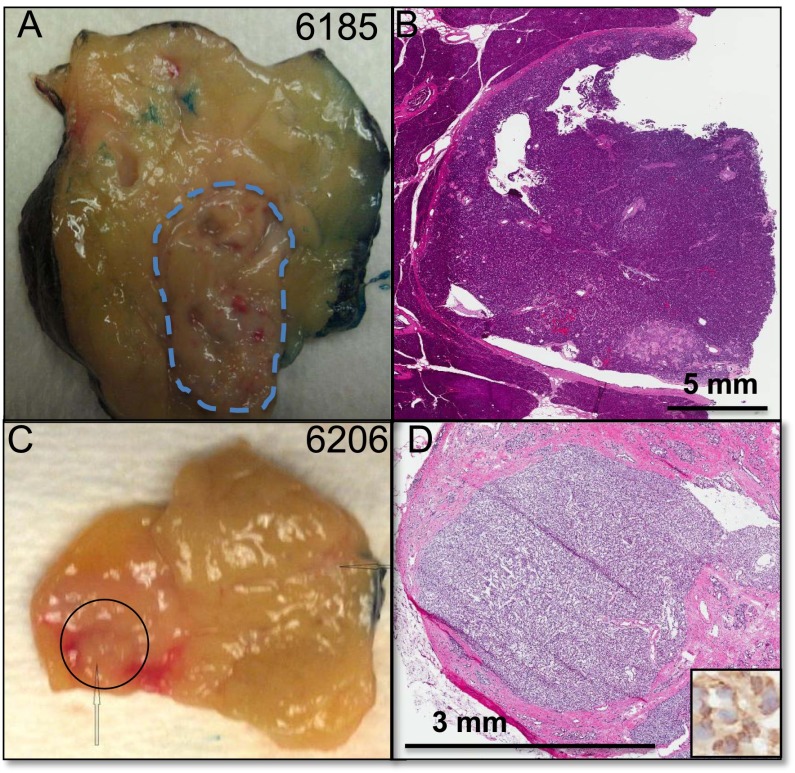
Controversy exists regarding the potential regenerative influences of incretin therapy on pancreatic β-cells versus possible adverse pancreatic proliferative effects. Examination of pancreata from age-matched organ donors with type 2 diabetes mellitus (DM) treated by incretin therapy (n = 8) or other therapy (n = 12) and nondiabetic control subjects (n = 14) reveals an ∼40% increased pancreatic mass in DM treated with incretin therapy, with both increased exocrine cell proliferation (P < 0.0001) and dysplasia (increased pancreatic intraepithelial neoplasia, P < 0.01). Pancreata in DM treated with incretin therapy were notable for α-cell hyperplasia and glucagon-expressing microadenomas (3 of 8) and a neuroendocrine tumor. β-Cell mass was reduced by ∼60% in those with DM, yet a sixfold increase was observed in incretin-treated subjects, although DM persisted. Endocrine cells costaining for insulin and glucagon were increased in DM compared with non-DM control subjects (P < 0.05) and markedly further increased by incretin therapy (P < 0.05). In conclusion, incretin therapy in humans resulted in a marked expansion of the exocrine and endocrine pancreatic compartments, the former being accompanied by increased proliferation and dysplasia and the latter by α-cell hyperplasia with the potential for evolution into neuroendocrine tumors.
Figures


Comment in
-
Incretin therapy and islet pathology: a time for caution.Diabetes. 2013 Jul;62(7):2178-80. doi: 10.2337/db13-0520. Epub 2013 Apr 17. Diabetes. 2013. PMID: 23596147 Free PMC article. No abstract available.
-
Comment on: Butler et al. Marked expansion of exocrine and endocrine pancreas with incretin therapy in humans with increased exocrine pancreas dysplasia and the potential for glucagon-producing neuroendocrine tumors. Diabetes 2013;62:2595-2604.Diabetes. 2013 Oct;62(10):e16-7. doi: 10.2337/db13-0690. Diabetes. 2013. PMID: 24065798 Free PMC article. No abstract available.
-
Comment on: Butler et al. Marked expansion of exocrine and endocrine pancreas with incretin therapy in humans with increased exocrine pancreas dysplasia and the potential for glucagon-producing neuroendocrine tumors. Diabetes 2013;62:2595-2604.Diabetes. 2013 Oct;62(10):e18. doi: 10.2337/db13-0525. Diabetes. 2013. PMID: 24065799 Free PMC article. No abstract available.
-
Response to comments on: Butler et al. Marked expansion of exocrine and endocrine pancreas with incretin therapy in humans with increased exocrine pancreas dysplasia and the potential for glucagon-producing neuroendocrine tumors. Diabetes 2013;62:2595-2604.Diabetes. 2013 Oct;62(10):e19-22. doi: 10.2337/db13-0996. Diabetes. 2013. PMID: 24065800 Free PMC article. No abstract available.
-
Reanalysis of study of pancreatic effects of incretin therapy: methodological deficiencies.Diabetes Obes Metab. 2014 Jul;16(7):661-6. doi: 10.1111/dom.12257. Epub 2014 Jan 29. Diabetes Obes Metab. 2014. PMID: 24400596 Free PMC article.
References
-
- Klöppel G, Löhr M, Habich K, Oberholzer M, Heitz PU. Islet pathology and the pathogenesis of type 1 and type 2 diabetes mellitus revisited. Surv Synth Pathol Res 1985;4:110–125 - PubMed
-
- Butler AE, Janson J, Bonner-Weir S, Ritzel R, Rizza RA, Butler PC. Beta-cell deficit and increased beta-cell apoptosis in humans with type 2 diabetes. Diabetes 2003;52:102–110 - PubMed
-
- Rahier J, Guiot Y, Goebbels RM, Sempoux C, Henquin JC. Pancreatic beta-cell mass in European subjects with type 2 diabetes. Diabetes Obes Metab 2008;10(Suppl. 4):32–42 - PubMed
-
- Xu G, Stoffers DA, Habener JF, Bonner-Weir S. Exendin-4 stimulates both beta-cell replication and neogenesis, resulting in increased beta-cell mass and improved glucose tolerance in diabetic rats. Diabetes 1999;48:2270–2276 - PubMed
Publication types
MeSH terms
Substances
Grants and funding
LinkOut - more resources
Full Text Sources
Other Literature Sources
Medical
