Meta-Analysis
. 2013 May;162(1):272-94.
doi: 10.1104/pp.113.217026. Epub 2013 Mar 22.

Identification of cytokinin-responsive genes using microarray meta-analysis and RNA-Seq in Arabidopsis

Affiliations
Meta-Analysis

Identification of cytokinin-responsive genes using microarray meta-analysis and RNA-Seq in Arabidopsis

Apurva Bhargava et al. Plant Physiol. 2013 May.

Abstract

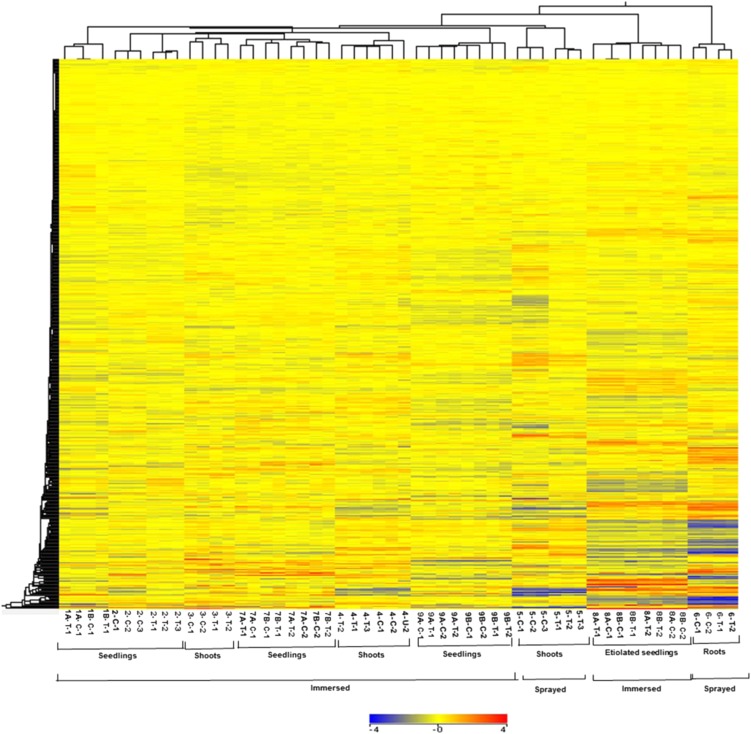
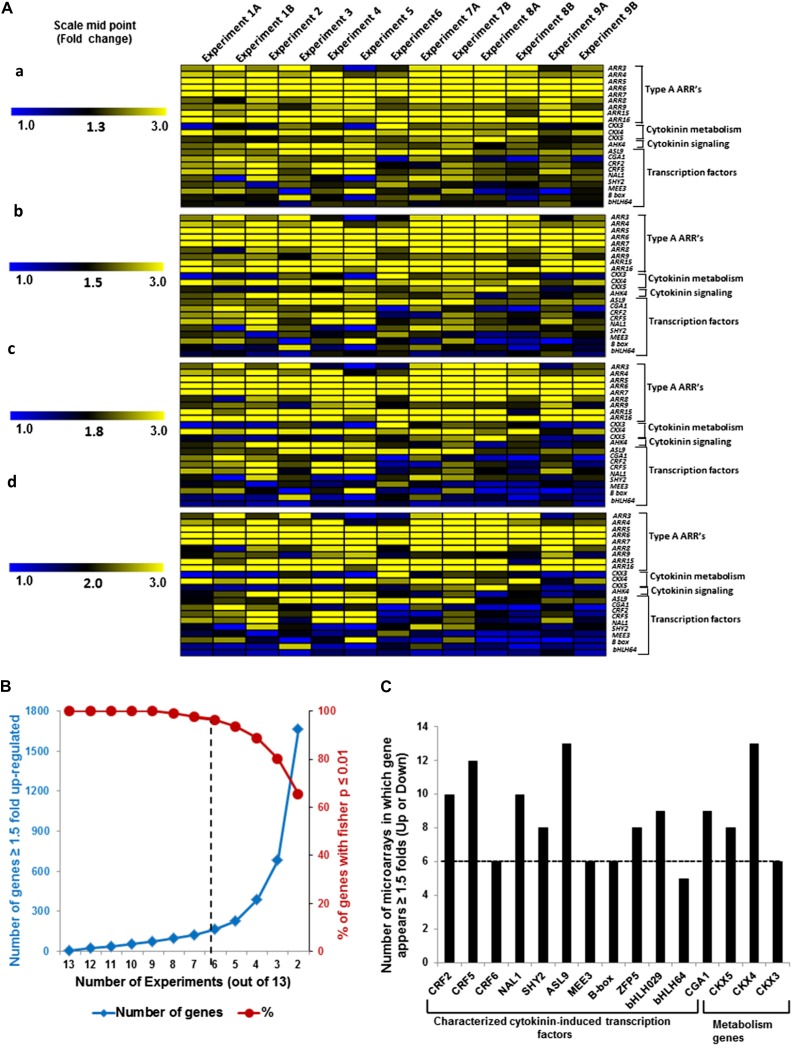
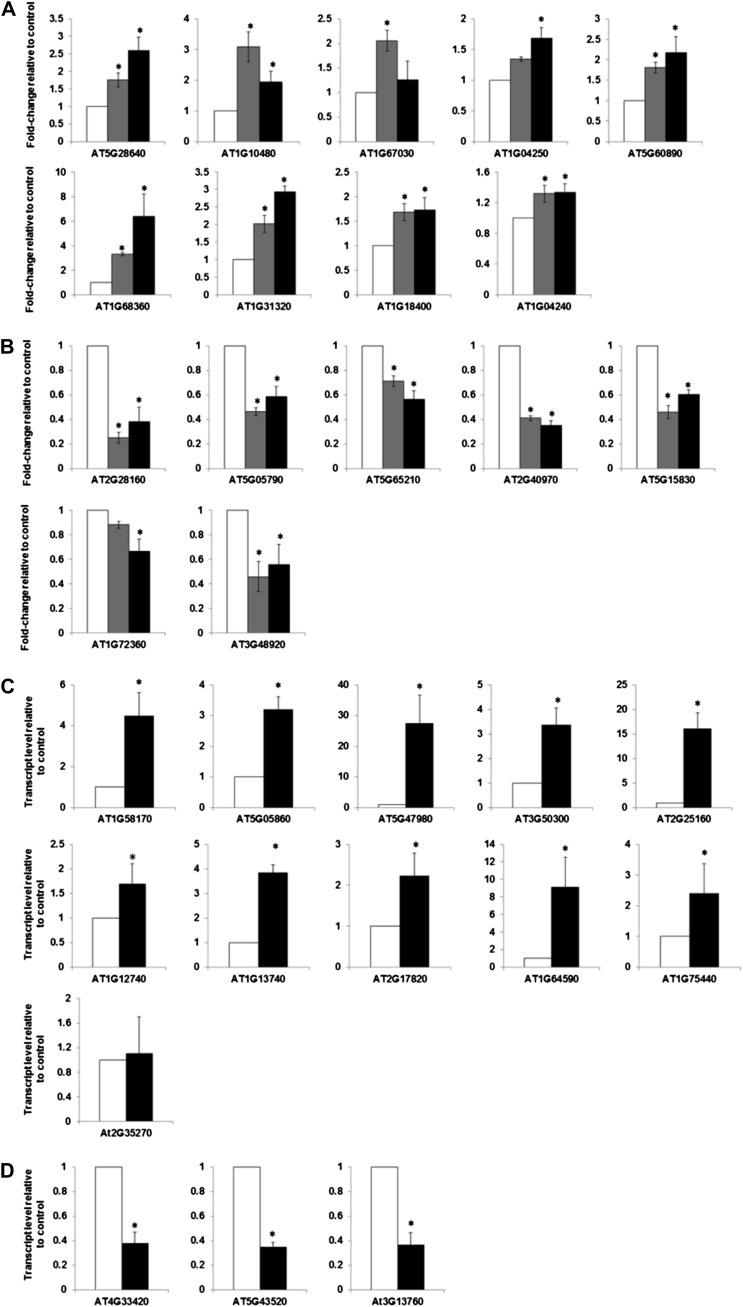
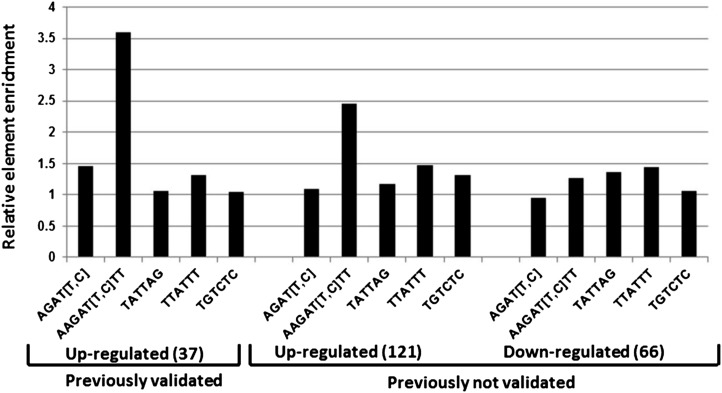
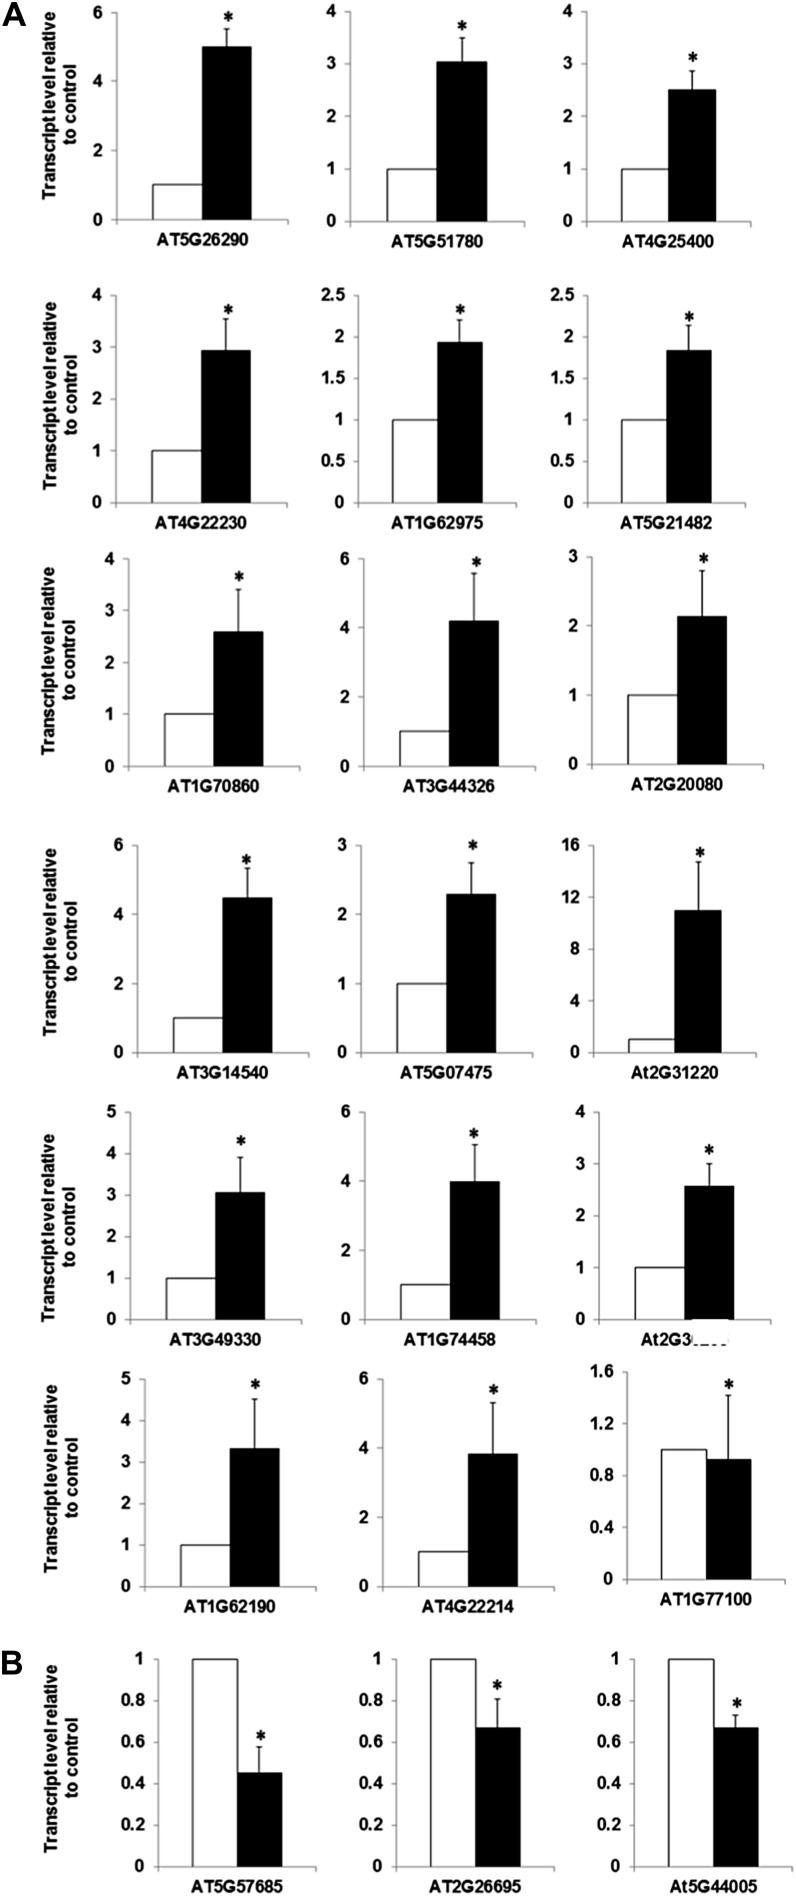
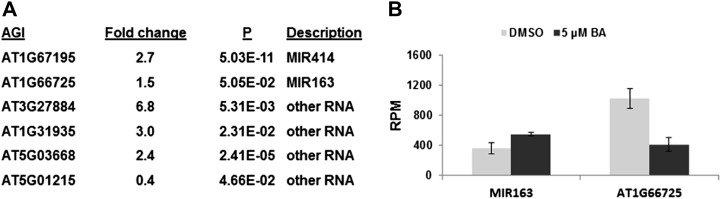
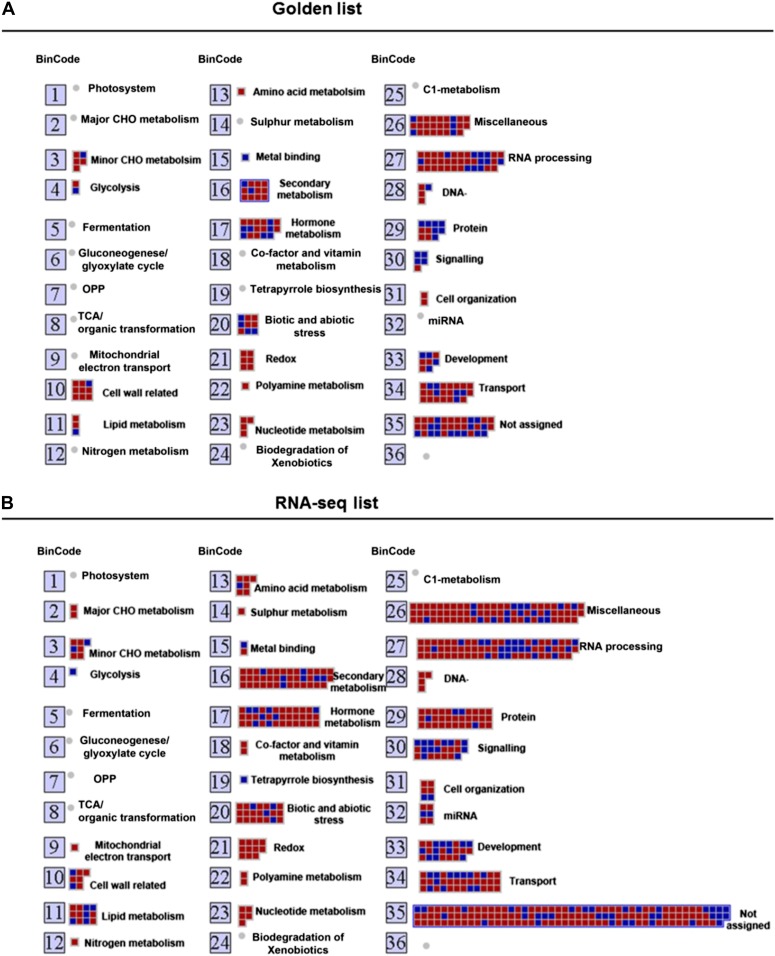
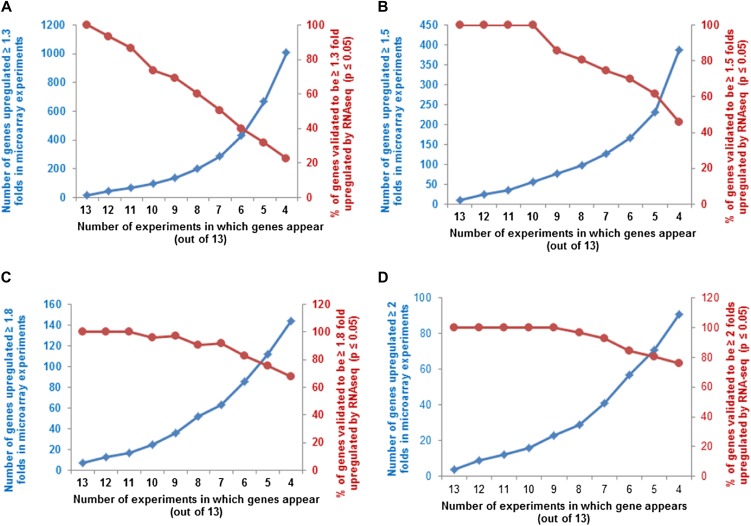
Cytokinins are N(6)-substituted adenine derivatives that play diverse roles in plant growth and development. We sought to define a robust set of genes regulated by cytokinin as well as to query the response of genes not represented on microarrays. To this end, we performed a meta-analysis of microarray data from a variety of cytokinin-treated samples and used RNA-seq to examine cytokinin-regulated gene expression in Arabidopsis (Arabidopsis thaliana). Microarray meta-analysis using 13 microarray experiments combined with empirically defined filtering criteria identified a set of 226 genes differentially regulated by cytokinin, a subset of which has previously been validated by other methods. RNA-seq validated about 73% of the up-regulated genes identified by this meta-analysis. In silico promoter analysis indicated an overrepresentation of type-B Arabidopsis response regulator binding elements, consistent with the role of type-B Arabidopsis response regulators as primary mediators of cytokinin-responsive gene expression. RNA-seq analysis identified 73 cytokinin-regulated genes that were not represented on the ATH1 microarray. Representative genes were verified using quantitative reverse transcription-polymerase chain reaction and NanoString analysis. Analysis of the genes identified reveals a substantial effect of cytokinin on genes encoding proteins involved in secondary metabolism, particularly those acting in flavonoid and phenylpropanoid biosynthesis, as well as in the regulation of redox state of the cell, particularly a set of glutaredoxin genes. Novel splicing events were found in members of some gene families that are known to play a role in cytokinin signaling or metabolism. The genes identified in this analysis represent a robust set of cytokinin-responsive genes that are useful in the analysis of cytokinin function in plants.


Figures

Figure 1.
Figure 1.
Hierarchical clustering of expression profiles of experiments used for microarray meta-analysis. Clustering of all the transcripts in control (C) and cytokinin-treated samples (T). The numbers below the image refer to the various experimental regimes described in Table I. The expression data were gene-wise normalized, and hierarchical clustering of gene expression patterns was carried out using GeneSpring software with Euclidean distance correlation for the two series of experiments, entities and variables. The color scale at the bottom represents the relative signal intensities.
Figure 2.
Figure 2.
Selection and validation of filters used for microarray meta-analysis of cytokinin-treated microarrays. A, Selection of appropriate fold change cutoff to use for the meta-analysis. A subset of the genes that has previously been confirmed to be induced by cytokinin (Supplemental Table S1) was used for this analysis. The relative expression of each gene in cytokinin versus control samples in each microarray experiment (Table I) was plotted with a midpoint value on the color scale of 1.3-, 1.5-, 1.8-, or 2-fold change as indicated. B, Examination of the number of genes that are up-regulated at least 1.5-fold in at least the number of microarray experiments noted on the x axis (blue line, left y axis), plotted along with the percentage of those genes thus identified that test as cytokinin regulated using a Fisher’s combined probability test with a P value of 0.01 or less (red line, right y axis). C, Number of microarrays in which a set of 15 genes previously demonstrated to be induced by cytokinin (Supplemental Table S1) show at least a 1.5-fold induction in the microarray experiments shown in Table I. The dashed line indicates the six or more microarrays chosen as the cutoff for inclusion in the list of robustly regulated genes.
Figure 3.
Figure 3.
Validation of golden list candidates by nCounter gene expression analysis and quantitative RT-PCR. A, NanoString nCounter gene expression analysis of up-regulated representative genes from the golden list. B, NanoString nCounter gene expression analysis of down-regulated representative genes from the golden list. For A and B, 10-d-old light-grown seedlings were treated with 5 μm BA or a DMSO vehicle control for 60 or 120 min as indicated, and the normalized counts for indicated transcripts were determined. Error bars indicate the mean ± se from three biological replicates. C, Relative transcript level of the up-regulated representative genes from the golden list as determined by quantitative RT-PCR. D, Relative transcript level of the down-regulated representative genes from the golden list as determined by quantitative RT-PCR. Ten-day-old light-grown seedlings treated with 5 μm BA or a DMSO vehicle control for 120 min were used for quantitative RT-PCR. The level of transcript relative to the DMSO control is shown as a mean of three biological replicates ± se of the mean.
Figure 4.
Figure 4.
The frequency of various transcription factor motifs in the promoters of cytokinin-regulated versus unregulated genes. The frequency of various transcription factor binding motifs as indicated (a type-B core motif, AGAT [T/C]; the extended motif determined for ARR1, AAGAT [T/C]TT; a type-B motif defined from cucumber, TATTAG; a TATA box element, TTATTT; and an Aux-RE element, TGTCTC) were quantified in the promoter regions (defined as 1,000 bp upstream of the translational start site) of the validated up-regulated genes and the nonvalidated up- and down-regulated genes identified by microarray meta-analysis (Tables II and III) using the Motif Mapper of the TOUCAN 2 workbench. The number of motifs present in the promoters of the regulated genes was divided by the number of motifs present in an equal number of promoters from random genes whose level was found to be unchanged by cytokinin in all microarray experiments used in the meta-analysis. Aux-RE was chosen as a negative control.
Figure 5.
Figure 5.
Validation of the cytokinin regulation of a subset of genes identified by RNA-seq that is not present on the ATH1 microarrays. A, Relative transcript level of the up-regulated indicated genes. B, Relative transcript level of the down-regulated indicated genes. Ten-day-old light-grown seedlings were treated with 5 µm BA or a DMSO vehicle control for 120 min and were determined by quantitative RT-PCR. The level of transcript relative to the DMSO control is shown as a mean of three biological replicates ± se of the mean.
Figure 6.
Figure 6.
Cytokinin-regulated expression of nonprotein-coding genes as identified by RNA-seq. A, List of genes regulated by cytokinin with the fold change of the transcript level for each gene in cytokinin-treated versus control samples indicated. B, Expression of MIR163 and its potential target (AT1G66725, S-adenosyl-l-Met-dependent methyltransferase) in cytokinin-treated and control samples as determined by RNA-seq. Expression is expressed as reads per million (RPM).
Figure 7.
Figure 7.
Functional analysis of cytokinin-regulated genes by MapMan. Overview of the distribution of genes in different functional groups as identified by MapMan analysis from the golden list (A) and RNA-seq (B). Gray/red boxes correspond to up-regulated genes and black/blue boxes to down-regulated genes. The numbers refer to the bin designations as defined in MapMan. [See online article for color version of this figure.]
Figure 8.
Figure 8.
Percentage of genes present in multiple microarrays validated by RNA-seq at different fold change cutoffs. A to D, The number of genes that are up-regulated at least 1.3-fold (A), 1.5-fold (B), 1.8-fold (C), or 2-fold (D), in at least the number of microarray experiments noted on the x axis (squares, left y axis), plotted along with the percentage of those genes thus identified that test as cytokinin regulated from the RNA-seq analysis using P ≤ 0.05 (circles, right y axis). [See online article for color version of this figure.]

Similar articles

Cited by

References

    1. Aerts S, Van Loo P, Thijs G, Mayer H, de Martin R, Moreau Y, De Moor B. (2005) TOUCAN 2: the all-inclusive open source workbench for regulatory sequence analysis. Nucleic Acids Res 33: W393–W396 - PMC - PubMed
    1. An L, Zhou Z, Sun L, Yan A, Xi W, Yu N, Cai W, Chen X, Yu H, Schiefelbein J, et al. (2012) A zinc finger protein gene ZFP5 integrates phytohormone signaling to control root hair development in Arabidopsis. Plant J 72: 474–490 - PubMed
    1. Anders S, Huber W. (2010) Differential expression analysis for sequence count data. Genome Biol 11: R106. - PMC - PubMed
    1. Argueso CT, Ferreira FJ, Epple P, To JP, Hutchison CE, Schaller GE, Dangl JL, Kieber JJ. (2012) Two-component elements mediate interactions between cytokinin and salicylic acid in plant immunity. PLoS Genet 8: e1002448. - PMC - PubMed
    1. Argueso CT, Ferreira FJ, Kieber JJ. (2009) Environmental perception avenues: the interaction of cytokinin and environmental response pathways. Plant Cell Environ 32: 1147–1160 - PubMed

Publication types

MeSH terms