. 2013 May;9(5):326-32.
doi: 10.1038/nchembio.1214. Epub 2013 Mar 24.

Ligand-binding dynamics rewire cellular signaling via estrogen receptor-α

Affiliations

Ligand-binding dynamics rewire cellular signaling via estrogen receptor-α

Sathish Srinivasan et al. Nat Chem Biol. 2013 May.

Abstract

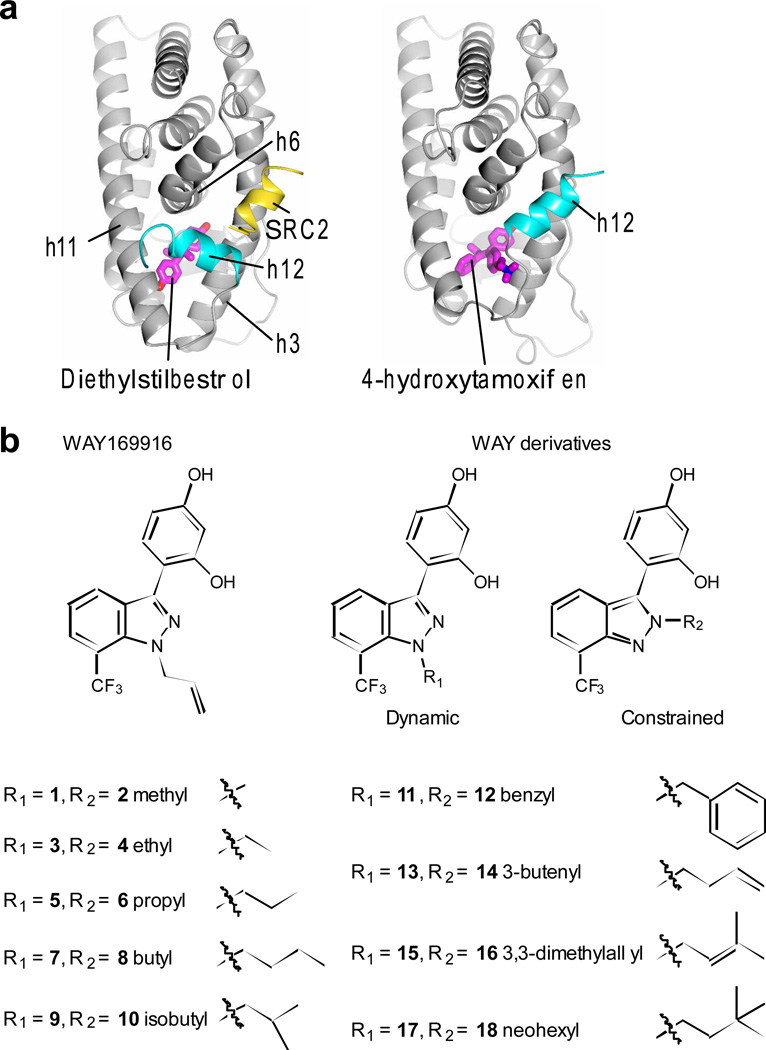
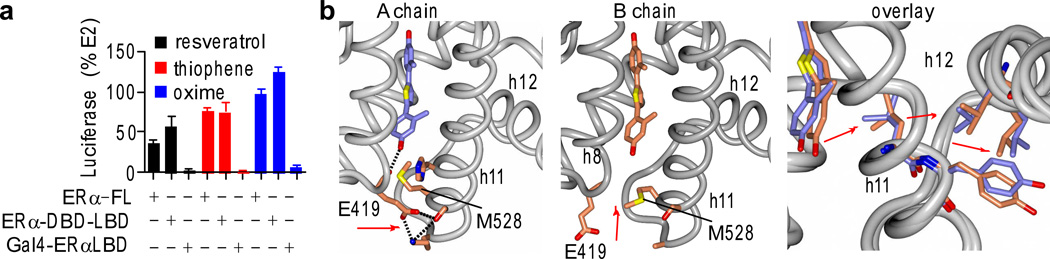
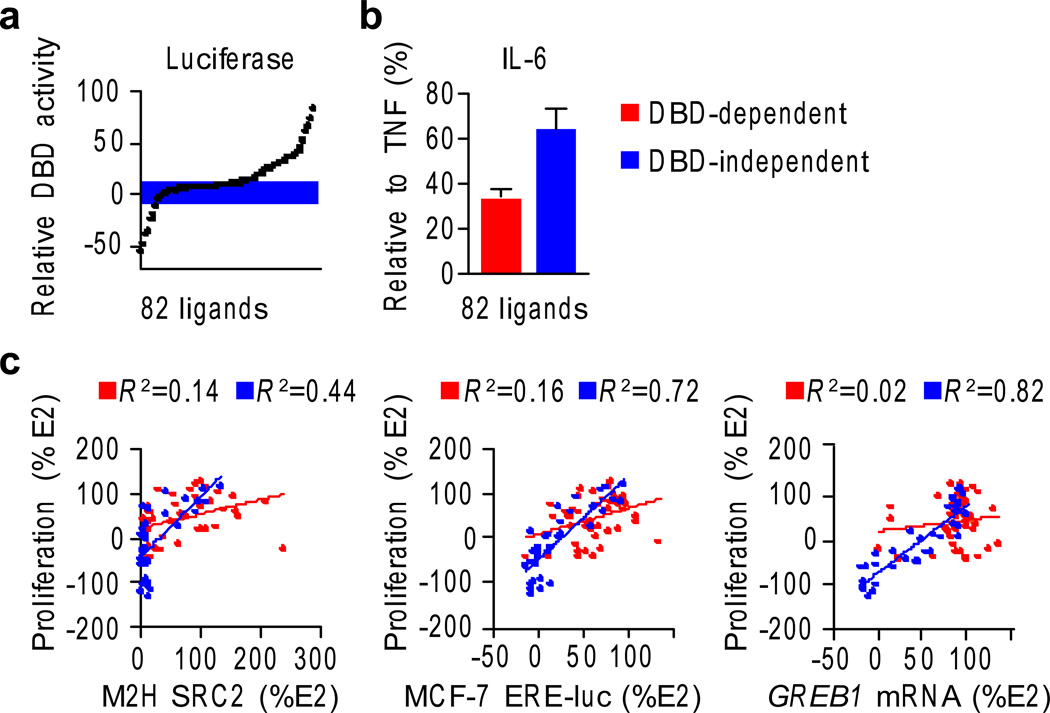
Ligand-binding dynamics control allosteric signaling through the estrogen receptor-α (ERα), but the biological consequences of such dynamic binding orientations are unknown. Here, we compare a set of ER ligands having dynamic binding orientation (dynamic ligands) with a control set of isomers that are constrained to bind in a single orientation (constrained ligands). Proliferation of breast cancer cells directed by constrained ligands is associated with DNA binding, coactivator recruitment and activation of the estrogen-induced gene GREB1, reflecting a highly interconnected signaling network. In contrast, proliferation driven by dynamic ligands is associated with induction of ERα-mediated transcription in a DNA-binding domain (DBD)-dependent manner. Further, dynamic ligands showed enhanced anti-inflammatory activity. The DBD-dependent profile was predictive of these signaling patterns in a larger diverse set of natural and synthetic ligands. Thus, ligand dynamics directs unique signaling pathways and reveals a new role of the DBD in allosteric control of ERα-mediated signaling.


Figures

Figure 1
Figure 1. ERα structure and ligand sets
a) The LBD is shown as ribbon, with h12 bound to either full-agonist diethylstilbesterol (PDB ID: 3ERD) or tamoxifen (PDB ID: 3ERT), demonstrating how tamoxifen positioning of h12 blocks binding of SRC2. b) Ligand isomer pairs were designed with the R group at a position that allows for ligand dynamics or at an adjacent atom, such that it only binds to ER in one constrained orientation.
Figure 2
Figure 2. Structural validation of ligand binding
a) The ERα LBD was crystallized with both of the benzyl isomers. Select ligand-binding pocket residues that lie in the indicated helices are shown. b) The CF3 group in the ligand provided signal for NMR determination of the local chemical environment of the indicated ligands, data for ligand alone in solution (free) or interacting with ERα.
Figure 3
Figure 3. Ligand phenotyping
a) MCF-7 breast cancer cells were switched to steroid-free serum and treated with 10 µM compound or control, including estradiol (E2), 4-hydroxytamoxifen (Tam) and the full ER antagonist ICI 182,780 (ICI). Growth was assayed after 7 days and normalized to the E2 response. Data represent mean values ± s.e.m. b) MCF-7 cells were stimulated with 10 ng/ml TNFα + test compounds, and secreted IL-6 was quantitated after 24 hr, using AlphaLISA. Data represent mean values ± s.e.m. c) MCF-7 and Ishikawa cells were transfected with 3xERE-luciferase reporter for assays of native ERα activity. Liver (HepG2) cells were transfected with the 3xERE- or Gal4-luciferase reporters, and the indicated ERα expression plasmids. Class averages for dynamic versus constrained ligands are shown. Data represent mean values ± s.e.m. d) The DNA-binding profile was determined in HEK293T cells transfected with a fusion of ERα to the strong activation domain of VP16 on the 3xERE-luciferase reporter, which overrides the ER ligand pharmacology. Plotted is the difference in normalized data (% relative to E2) between the isomer pairs, showing that the dynamic ligands have greater DNA binding activity profile for each pair.
Figure 4
Figure 4. Cellular correlates of ER proliferation
a) Cross-correlation matrix for R2 between all the bioassays. Linear regression analysis was performed to identify relationships between the assays. The R2 ranges are shown as a heat map. The slope of the regression line indicates whether the associations are positively or negatively correlated with the dynamic-ligand data on the top and the constrained-ligand data on the bottom. (Proliferation – MCF-7 proliferation assay; IL-6 – TNFα induced IL-6 expression measured by AlphaLISA in MCF-7 cells; cMYC, CCND1, and pS2 – mRNA measured in MCF-7 cells; MCF-7 and Ishikawa – ERE-Luciferase driven by endogenous ERα; ERα-FL, ERα-DBD-LBD and GAL4-ERα-LBD – ERE-Luciferase assays in HepG2 cells; M2H SRC1, M2H SRC2 and M2H SRC3 – mammalian 2-hybrid assays with ERα as the bait and with either SRC1, SRC2 or SRC3 as prey; M2H SRC1 LBD – mammalian 2-hybrid assays with ERα-LBD as the bait and with SRC1 as prey; DIMER α/α and α/β – dimerization between ERα homodimers and ERα/β heterodimers measured using BRET assay). All assays are represented as percentage of E2 response, except for IL-6, which is represented as percentage of TNFα stimulated IL-6. The assays are described in detail in Supplementary Table 2 and online methods. The R2 values are shown in Supplementary Figure 10. b) Data from the dynamic ligands are red, while the data from the constrained ligands are blue for the indicated assays. The linear regression plots are shown with the R2 values.
Figure 5
Figure 5. Identification of dynamic ligands based on DBD profile
a) Three compounds from a larger test set of 82 compounds showed DBD-specific activity profiles that match the data profiles from the dynamic WAY-169916 derivatives. Assays were performed as in Figure 3a. Data represent mean values ± s.e.m. b) Structure of ERα LBD bound to a thiophene ligand shows two different binding orientations on the two sides of the dimer, protein chain A and B, including differences in a ligand associated hydrogen bonding network found only chain A. An overlay of the models highlights the ligand-induced differences in ligand binding and the packing between h11 and h12.
Fig. 6
Fig. 6. DBD-activity profile predicts signaling outcomes
a) A DBD-activity profile was calculated for the larger test set by subtracting the ERα-Gal4-LBD luciferase data from the ERα-DBD-LBD luciferase data in HepG2 liver cells, indicating the relative contribution of the DBD to the gene activation signal. The compounds were binned into DBD-independent (i.e. relative DBD activity is close to zero) versus DBD-dependent profiles. b) The IL-6 assay was performed for the larger test set, and results examined with respect to the DBD activity profiles. Data represent mean values ± s.e.m. c) The larger ligand test set was assayed for the indicated screens as described for the WAY-169916 derivatives, and was analyzed based on their DBD-activity profile. R2 values obtained from linear regression analysis are indicated. Data are colored as in panel b.

References

    1. Hilser VJ, Wrabl JO, Motlagh HN. Structural and energetic basis of allostery. Annual review of biophysics. 2012;41:585–609. - PMC - PubMed
    1. Carroll MJ, et al. Evidence for dynamics in proteins as a mechanism for ligand dissociation. Nature chemical biology. 2012;8:246–252. - PMC - PubMed
    1. Shiau AK, et al. The structural basis of estrogen receptor/coactivator recognition and the antagonism of this interaction by tamoxifen. Cell. 1998;95:927–937. - PubMed
    1. Nettles KW, et al. CBP Is a dosage-dependent regulator of nuclear factor-kappaB suppression by the estrogen receptor. Mol Endocrinol. 2008;22:263–272. - PMC - PubMed
    1. Bruning JB, et al. Coupling of receptor conformation and ligand orientation determine graded activity. Nature chemical biology. 2010;6:837–843. - PMC - PubMed

Publication types

LinkOut - more resources