. 2013 May;16(5):613-21.
doi: 10.1038/nn.3356. Epub 2013 Mar 24.

Physiologic brain activity causes DNA double-strand breaks in neurons, with exacerbation by amyloid-β

Affiliations

Physiologic brain activity causes DNA double-strand breaks in neurons, with exacerbation by amyloid-β

Elsa Suberbielle et al. Nat Neurosci. 2013 May.

Abstract

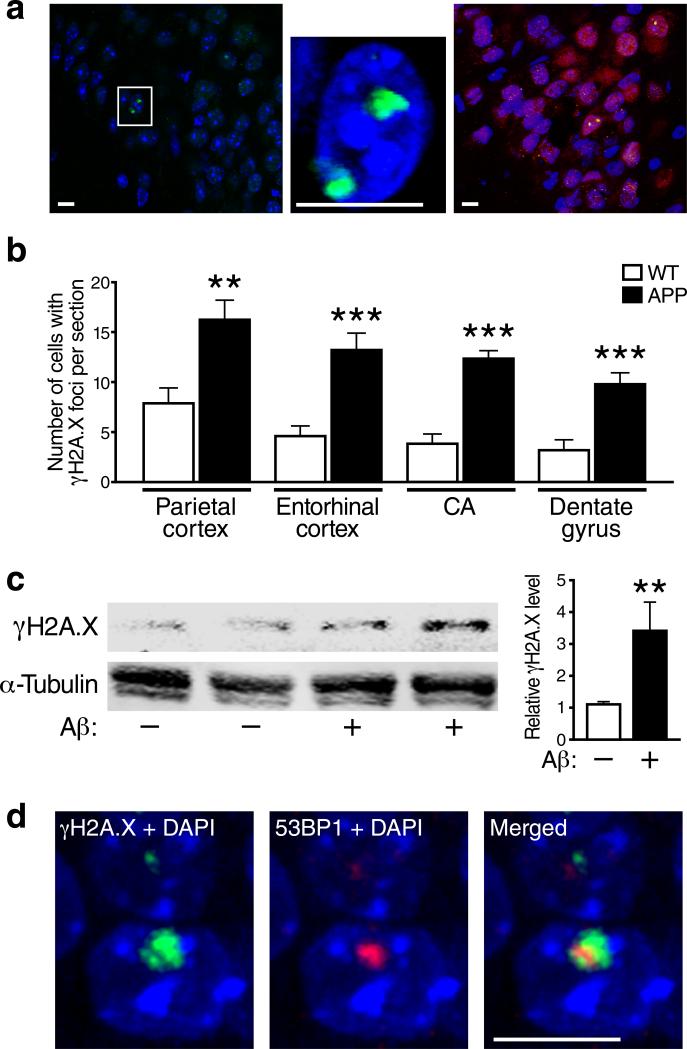
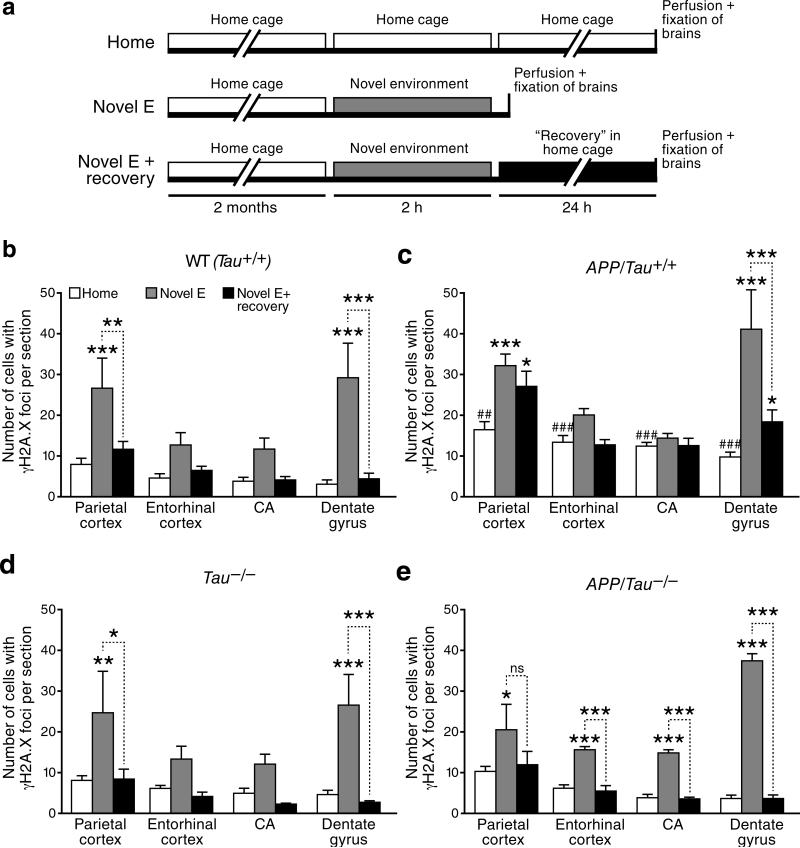
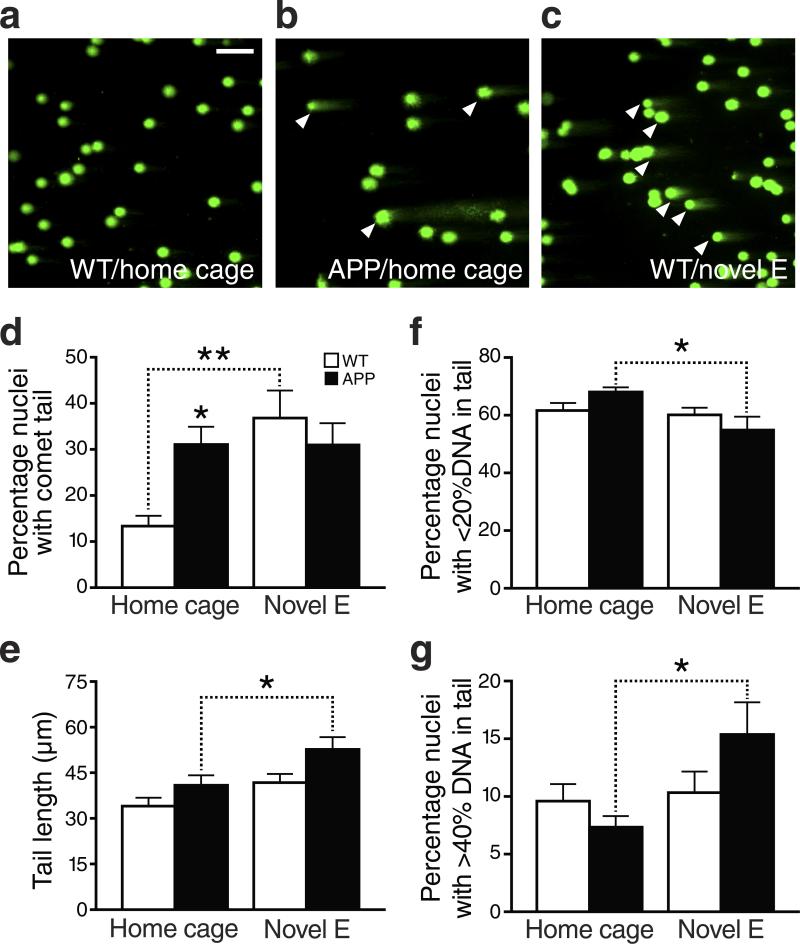
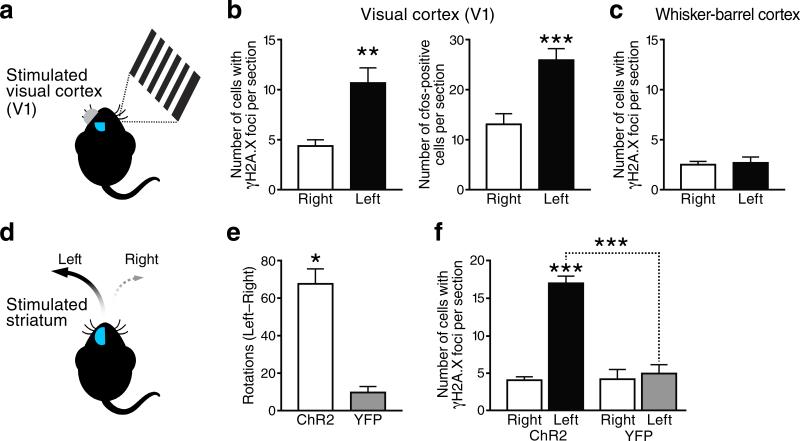
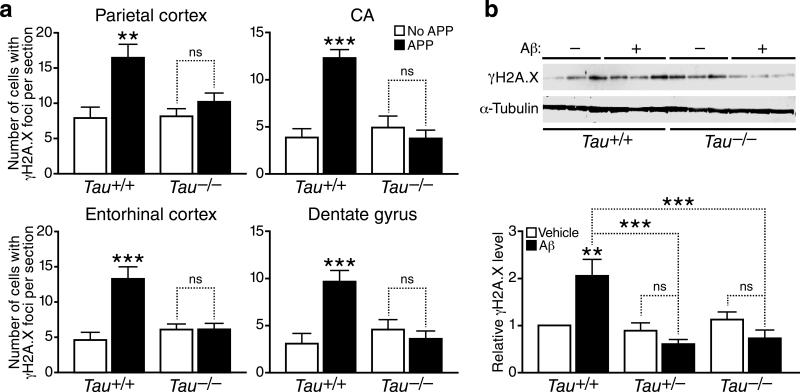
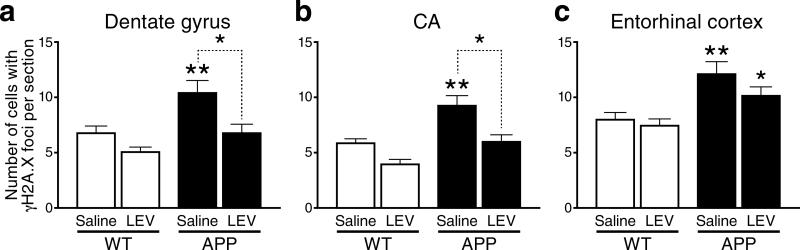
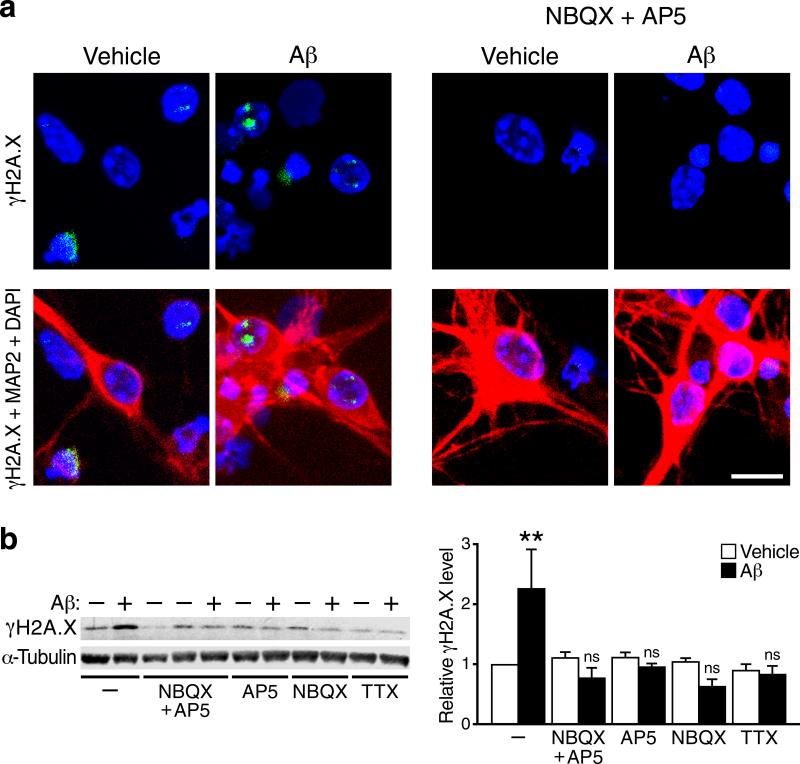
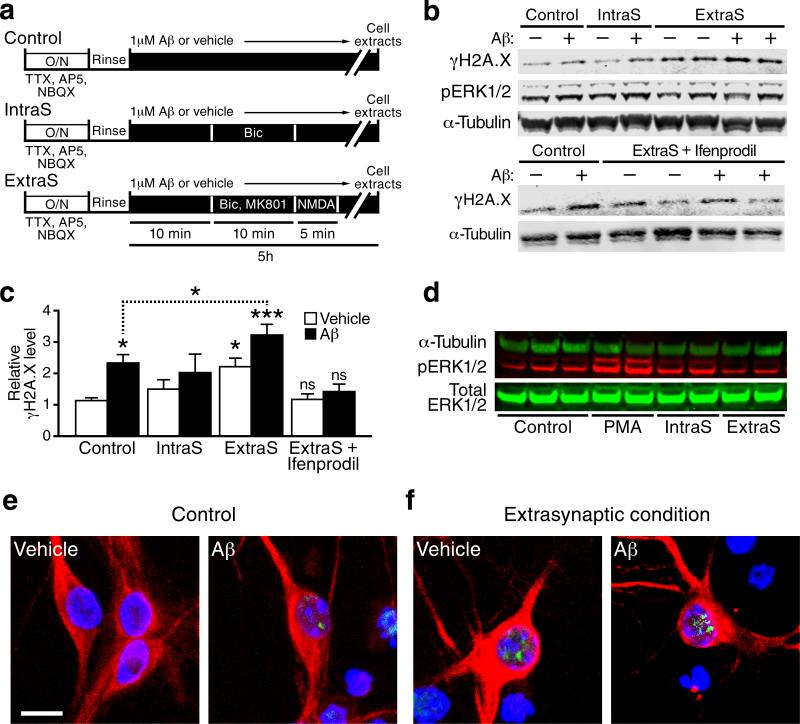
We show that a natural behavior, exploration of a novel environment, causes DNA double-strand breaks (DSBs) in neurons of young adult wild-type mice. DSBs occurred in multiple brain regions, were most abundant in the dentate gyrus, which is involved in learning and memory, and were repaired within 24 h. Increasing neuronal activity by sensory or optogenetic stimulation increased neuronal DSBs in relevant but not irrelevant networks. Mice transgenic for human amyloid precursor protein (hAPP), which simulate key aspects of Alzheimer's disease, had increased neuronal DSBs at baseline and more severe and prolonged DSBs after exploration. Interventions that suppress aberrant neuronal activity and improve learning and memory in hAPP mice normalized their levels of DSBs. Blocking extrasynaptic NMDA-type glutamate receptors prevented amyloid-β (Aβ)-induced DSBs in neuronal cultures. Thus, transient increases in neuronal DSBs occur as a result of physiological brain activity, and Aβ exacerbates DNA damage, most likely by eliciting synaptic dysfunction.


Figures

Figure 1
Figure 1. Aβ increases neuronal γH2A.X formation in vivo and in vitro
(a, b) γH2A.X-positive foci in immunostained brain sections from 6-month-old wildtype and hAPP mice were visualized by confocal microscopy. (a) γH2A.X-positive foci (green) were localized in nuclei labeled with DAPI (blue) and were found primarily in cells co-labeled with an antibody to the neuronal marker NeuN (red, right panel). The middle panel shows a higher magnification image of the area within the white box in the left panel. Images were taken from the entorhinal cortex of an hAPP mouse. Scale bars: 10 μm. (b) Numbers of cells with γH2A.X-positive foci per section in different brain regions of wildtype (WT) and hAPP (APP) mice (n=8 mice/genotype). (c) Cultures of primary forebrain neurons from wildtype mice were exposed to Aβ oligomers (1 μM)(+) or vehicle (–) for 4 h. γH2A.X levels were then determined by western blot analysis. α-Tubulin served as a loading control. A representative western blot is shown on the left and quantifications of western blot signals on the right (n=8–12 wells per condition from 4 independent experiments). (d) Representative example of an γH2A.X-positive focus (green) double-labeled with anti-53BP1 (red) in a DAPI-labeled (blue) neuronal nucleus in the dentate gyrus of a 6-month-old hAPP mouse. **p<0.01, ***p<0.001 (two-tailed, unpaired Student's t-test). Bars represent means ± SEM.
Figure 2
Figure 2. Modulation of DSBs by exploration of a novel environment, overexpression of hAPP/Aβ and reduction of endogenous tau
(a) Schematic outline of the experimental design (see Methods for details). For all experiments, investigators were blinded with respect to the genotype and treatment of mice. (b–e) For each brain region, the number of γH2A.X-positive foci in 4–6-month-old mice of the indicated genotypes was counted. n=4–9 mice per genotype and treatment from 2 independent experiments. *p<0.05; ***p<0.001 vs. mice of the same genotype exposed to the home cage condition, or as indicated by bracket. ##p<0.01; ###p<0.001 vs. WT (Tau+/+) mice exposed to the home cage condition (Bonferroni post-hoc test). Bars represent means ± SEM.
Figure 3
Figure 3. Exploration- and hAPP/Aβ-induced increases in DNA damage detected by the comet assay
Cells isolated from dentate gyrus homogenates were assessed for DSB levels by the comet assay at neutral pH. (a–c) Representative images of cell nuclei from wildtype (a) and hAPP (b) mice taken from their home cage (control condition), and from a wildtype mouse that had just explored a novel environment (Novel E) for 2 hours (c). DNA of the agarose-embedded nuclei was stained with SYBR-green after separation of DNA fragments by electrophoresis. Images were captured by fluorescence microscopy. Scale bar: 50 μm. (d) Quantification of the percentage of nuclei with comet tails, which are indicative of DSBs. For each mouse, a total of 600-800 nuclei within 2 fields were inspected and scored. (e) Tail length (in μm), indicating the extent of DNA fragmentation, was measured for each cell showing a comet. (f, g) Proportion of comet-bearing nuclei with <20% (f) or >40% (g) fragmented DNA. n=6–9 mice per genotype and condition. *p<0.05 , **p<0.01 vs. leftmost bar or as indicated by bracket (Bonferroni post-hoc test). Bars represent means ± SEM.
Figure 4
Figure 4. Network-specific modulation of DSBs by stimulation of primary visual cortex or striatal indirect-pathway neurons
(a–c) Modulation of DSBs by unilateral visual stimulation of 4-month-old anesthetized mice (n=6). (a) Schematic representation of the experimental design (see Methods for details). Only the right eye was stimulated, whereas the left eye was shielded from light. (b) Numbers of cells with γH2A.X-positive foci (left) and of c-Fos-positive cells (right) in the primary visual cortex (V1). (c) Numbers of cells with γH2A.X-positive foci in the whisker-barrel cortex of the same mice. (d–f) Modulation of DSBs and motor behavior by unilateral optogenetic stimulation of the striatum in awake-behaving mice. (d) Schematic representation of the experimental design. Two-month-old mice expressing channel-2-rhodopsin-YFP (Ch2R) in indirect pathway neurons were compared to age-matched mice expressing YFP alone (YFP) (n=3–6 mice per group). The turning behavior of mice was recorded after stimulation of the left striatum. (e) Difference between the numbers of times mice turned left versus right in one hour. Indirect-pathway stimulation induced ipsilateral rotations. The slight trend of YFP mice to turn more left than right was not significant by one-sample t-test. (f) Numbers of cells with γH2A.X-positive foci in the right and left striatum. *p<0.05, **p<0.01, ***p<0.001 by two-tailed paired Student's t-test (b, c and e) or vs. leftmost bar and as indicated by brackets (Tukey-Kramer test). Bars represent means ± SEM.
Figure 5
Figure 5. Tau reduction prevents the Aβ-induced increase in neuronal γH2A.X foci
(a) Numbers of cells with γH2A.X-positive foci per section in different brain regions of 4-mont-hold Tau+/+ and Tau–/– mice with or without hAPP expression (n=5–9 mice/genotype). (b) Primary forebrain neurons cultured for 15 days in vitro (DIV 15) from mice of the indicated Tau genotypes were treated with Aβ oligomers (1 μM)(+) or vehicle (–) and γH2A.X levels were determined by western blot analysis. Representative western blots show results from five culture wells and two genotypes (Tau+/+ and Tau–/–). Quantifications of western blot signals below were from 30 culture wells and three genotypes (Tau+/+, Tau+/– and Tau–/–). n=5 wells per condition from 3 independent experiments. **p<0.01, ***p<0.001 vs. leftmost bar or as indicated by brackets (Bonferroni post-hoc test). n.s., not significant. Bars represent means ± SEM.
Figure 6
Figure 6. Levetiracetam normalizes the number of γH2A.X foci in the hippocampus of hAPP mice
(a–c) Four- to five-month-old hAPP mice (n=5–8 per treatment) and wildtype controls (n=5–6 per treatment) were treated for 28 days with saline or levetiracetam (75 mg/kg/day by subcutaneous Alzet minipump). The numbers of cells with γH2A.X-positive foci per section were then determined by immunohistochemistry. *p<0.05, **p<0.01 vs. wildtype or as indicated by brackets (Bonferroni post-hoc test). Two-way ANOVA revealed effects of treatment and genotype (p<0.01). No significant interaction was observed between them in the hippocampus, and an effect of genotype only (p=0.0002) in entorhinal cortex.
Figure 7
Figure 7. Aβ-induced increases in γH2A.X in neuronal cultures depend on neuronal activity
(a) Primary cultures of wildtype mouse hippocampal neurons (15 DIV) were treated with Aβ oligomers (1 μM) or vehicle for 4 hours in the presence or absence of antagonists of AMPARs (NBQX) or NMDARs (APV) as indicated. Cultures were then triple-labeled for γH2A.X-positive foci (green), the neuronal marker MAP2 (red) and the nuclear marker DAPI (blue). Scale bar: 10 μm. (b) Primary cultures of wildtype mouse forebrain neurons were treated with Aβ oligomers (1 μM)(+) or vehicle (–) for 4 hours in the presence or absence of NBQX, APV, or the sodium channel blocker tetrodotoxin (TTX). γH2A.X levels were then determined by western blot analysis. A representative western blot is shown on the left and quantifications of western blot signals on the right. n=5–7 wells per condition from 5 independent experiments. **p<0.01 vs. leftmost bar (Tukey's post-hoc test). Bars represent means ± SEM.
Figure 8
Figure 8. Aβ-induced increases in γH2A.X-positive foci in primary neuronal cultures require activation of extrasynaptic NR2B-containing NMDARs
(a) Wildtype mouse hippocampal neuronal cultures were treated as summarized in the diagram (see Methods for details). Bic, bicuculline. ExtraS, extrasynaptic. IntraS, intrasynaptic. O/N, overnight. (b, c) Levels of pERK1/2 (b) and γH2A.X (b, c) in primary neurons treated as indicated were determined by western blot analysis. Representative western blots are shown in (b) and quantifications of γH2A.X signals in (c). n=5–12 wells per condition from 7 independent experiments. *p<0.05, ***p<0.001 vs. first bar (Dunnett's test) or as indicated by the brackets (two-tailed t-test). Bars represent means ± SEM. (d) Representative western blot showing the effects of the different treatments on phosphorylation of ERK1/2 (pERK1/2) 30 min after stimulation of cells in the absence of Aβ. PMA, a phorbol ester that activates PKA, leading to ERK1/2 phosphorylation, was used as a positive control. Compared with the control condition, pERK1/2 levels were higher under conditions favoring spontaneous activation of intrasynaptic NMDARs and lower under conditions favoring activation of extrasynaptic NMDARs. (e,f) Primary cultures of wildtype mouse hippocampal neurons plated at low density were treated with Aβ oligomers (1 μM) or vehicle for 4 hours under control conditions (e) or conditions favoring the activation of extrasynaptic NMDARs (f). Cells triple-labeled for γH2A.X (green), DAPI (blue) and MAP2 (red) to illustrate their neuronal morphology were visualized by immunostaining and confocal microscopy. Scale bars: 10 μm.

Comment in

References

    1. Brasnjevic I, Hof PR, Steinbusch HW, Schmitz C. Accumulation of nuclear DNA damage or neuron loss: Molecular basis for a new approach to understanding selective neuronal vulnerability in neurodegenerative diseases. DNA Repair (Amst) 2008;7:1087–1097. - PMC - PubMed
    1. Moreira PI, et al. Nucleic acid oxidation in Alzheimer disease. Free Radic. Biol. Med. 2008;44:1493–1505. - PubMed
    1. Lu T, et al. Gene regulation and DNA damage in the ageing human brain. Nature. 2004;429:883–891. - PubMed
    1. Bonner WM, et al. GammaH2AX and cancer. Nat. Rev. Cancer. 2008;8:957–967. - PMC - PubMed
    1. Ismail IH, Hendzel MJ. The gamma-H2A.X: Is it just a surrogate marker of double-strand breaks or much more? Environ. Mol. Mutagen. 2008;49:73–82. - PubMed

Publication types

MeSH terms