. 2013 May;16(5):552-61.
doi: 10.1038/nn.3359. Epub 2013 Mar 24.

The neuron-specific chromatin regulatory subunit BAF53b is necessary for synaptic plasticity and memory

Affiliations

The neuron-specific chromatin regulatory subunit BAF53b is necessary for synaptic plasticity and memory

Annie Vogel-Ciernia et al. Nat Neurosci. 2013 May.

Abstract

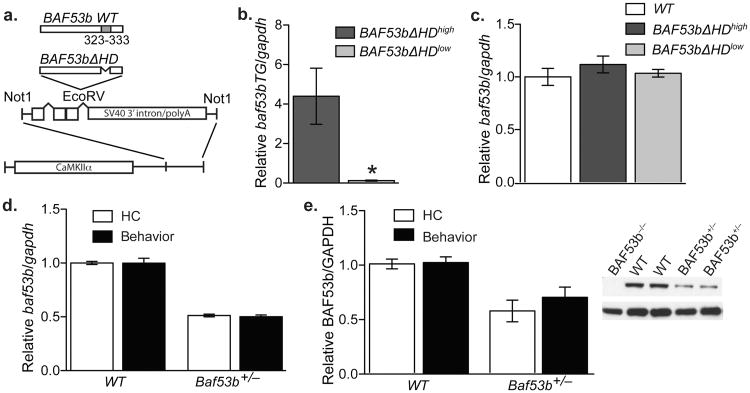
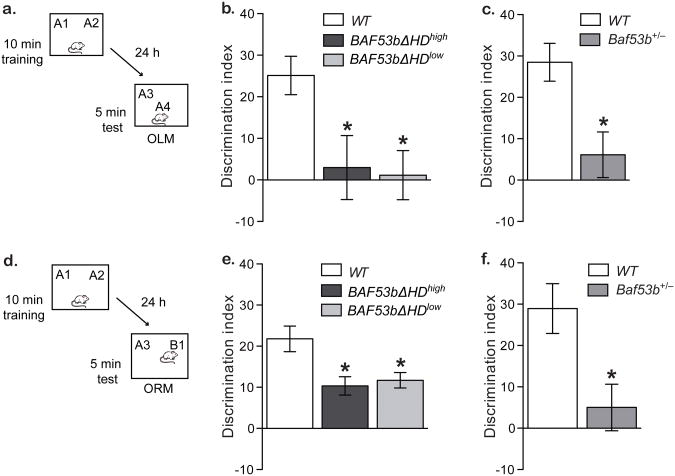
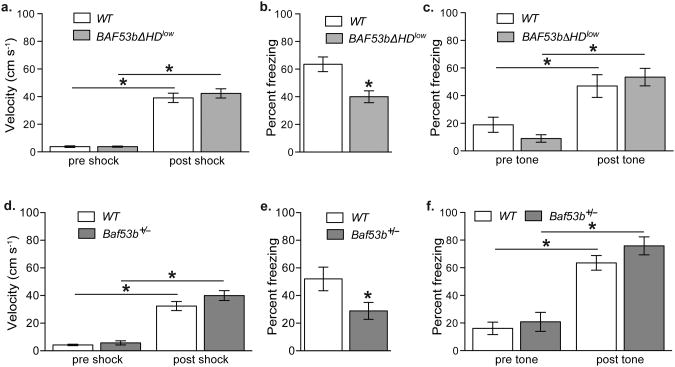
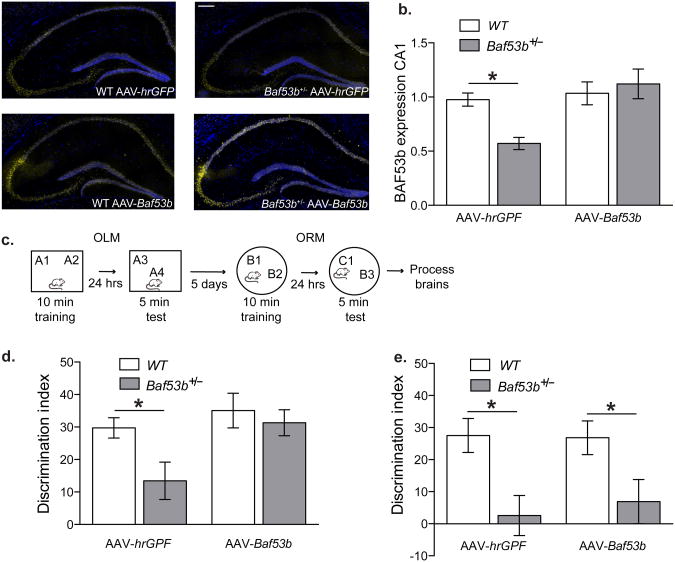
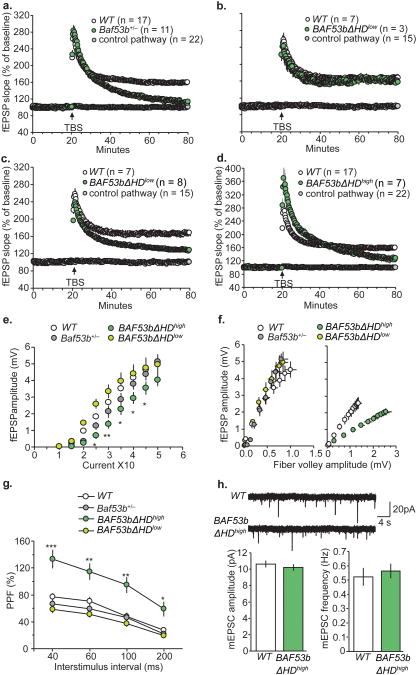
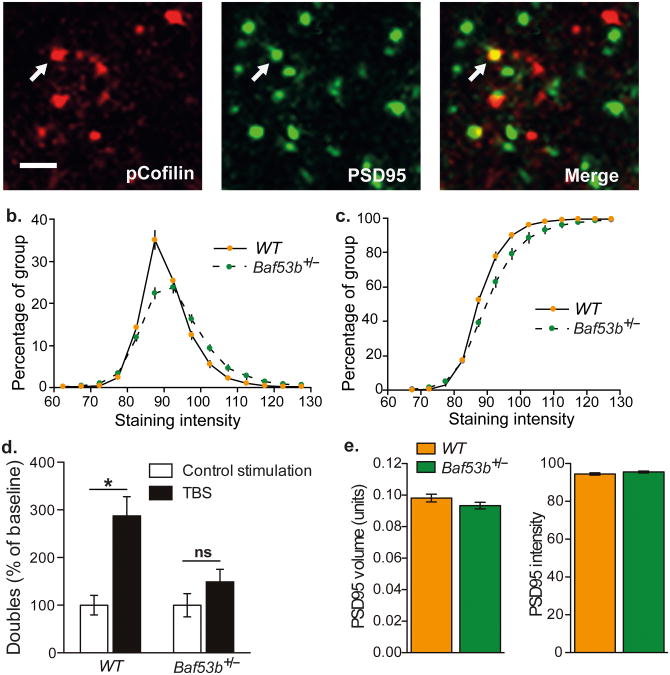
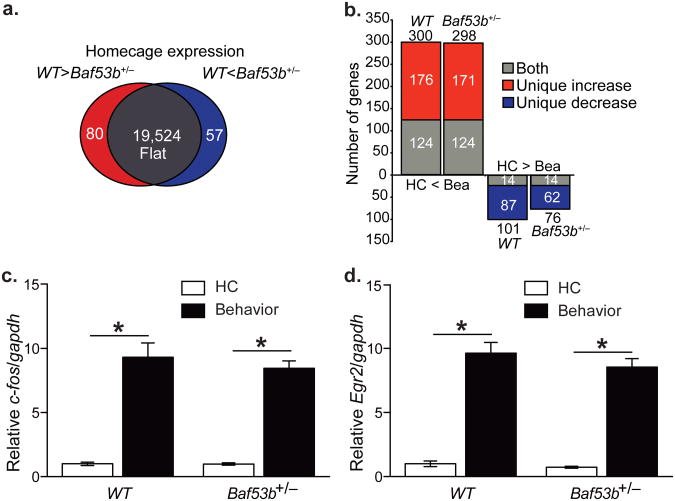
Recent exome sequencing studies have implicated polymorphic Brg1-associated factor (BAF) complexes (mammalian SWI/SNF chromatin remodeling complexes) in several human intellectual disabilities and cognitive disorders. However, it is currently unknown how mutations in BAF complexes result in impaired cognitive function. Postmitotic neurons express a neuron-specific assembly, nBAF, characterized by the neuron-specific subunit BAF53b. Mice harboring selective genetic manipulations of BAF53b have severe defects in long-term memory and long-lasting forms of hippocampal synaptic plasticity. We rescued memory impairments in BAF53b mutant mice by reintroducing BAF53b in the adult hippocampus, which suggests a role for BAF53b beyond neuronal development. The defects in BAF53b mutant mice appeared to derive from alterations in gene expression that produce abnormal postsynaptic components, such as spine structure and function, and ultimately lead to deficits in synaptic plasticity. Our results provide new insight into the role of dominant mutations in subunits of BAF complexes in human intellectual and cognitive disorders.


Figures

Figure 1
Figure 1
Characterization of BAF53bΔHD and Baf53b+/− het mice. (a) Wildtype BAF53b is diagramed with hydrophobic domain (HD) shown in grey. In the BAF53bΔHD construct the amino acids 323-333 within the hydrophobic domain were deleted. The BAF53bΔHD mutant sequence was cloned into a separate vector containing intron and exon sequences with splice sites and the SV40 intron and polyadenylation signal, which was then cloned downstream of the 8.5 kb mouse CaMKIIα promoter. This construct was used to generate BAF53bΔHD transgenic mice. (b) Quantitative RT-PCR was performed with transgene specific primers to measure transgene expression in dorsal hippocampus of two independently derived lines of BAF53bΔHD mice. We identified two significantly different lines (Mann-Whitney U (18)=0.00, p<0.0001): a low expressing line (n=10) and a high expressing line (n=10) (2 out of 12 founder lines). (c) Wildtype BAF53b expression in the dorsal hippocampus of BAF53bΔHDhigh (n=10) and BAF53bΔHDlow (n=11) is not significantly different (Kruskal-Wallis H2,33=4.03, p=0.13) between mutant mice and wildtype littermates (n=15). (d) Quantitative RT-PCR shows that wildtype Baf53b expression in the dorsal hippocampus of Baf53b+/− het mice (n=13) is significantly (2-way ANOVA main effect of genotype F1,18=17.87, p<0.001) reduced compared to wildtype littermates (n=8). There was no effect of behavior (F1,18=0.81, p=0.38) or interaction (F1,18=0.40, p=0.53) Mean (± SEM). (e) Western blot analysis shows that BAF53b protein in dorsal hippocampus of Baf53b+/− het mice (n=13) is significantly (2-way ANOVA main effect of genotype F1,17=345.0, p<0.0001) reduced compared to wildtype littermates (n=9). There was no effect of behavior (F1,17=0.05, p=0.82) or interaction (F1,17=0.03, p=0.85).
Figure 2
Figure 2
BAF53bΔHD and Baf53b+/− het mice have impaired long-term memory. (a) Mice received 10 min training in an environment with 2 identical objects and received a retention test 24 hrs later in which one object is moved to a new location (OLM). (b) BAF53bΔHDhigh mutant mice (n=9) and BAF53bΔHDlow (n=13) exhibit a significant 24 hr long-term OLM deficit (ANOVA F2,34=5.79, p<0.01) in a hippocampus-dependent task as compared to wildtype littermates (n=15) and were not significantly different from zero (BAF53bΔHDhigh t-test t(8)=0.39, p=0.71 and BAF53bΔHDlow t-test t(12)=0.19, p=0.85). There were no significant differences in total exploration time between the groups during testing (ANOVA F2,34=0.45, p=0.64) or training (ANOVA F2,34=1.13, p=0.33) (c) Baf53b+/− het mice (n=16) exhibit impaired long-term OLM compared to wildtype mice (n=6; t-test t(20)=2.35, p<0.05). There was no difference in overall exploration between the groups at training t-test t(20)=0.40, p=0.70 or testing t-test t(20)=0.95, p=0.35. (d) Mice received 10 min training in an environment with 2 identical objects and received a retention test 24 hrs later in which one object is replaced with a novel one. (e) In a hippocampus-independent object recognition task, BAF53bΔHDhigh mutant mice (n=12) and BAF53bΔHDlow (n=11) exhibit significant ORM deficits as compared to wildtype mice (n=18; Kruskal-Wallis H2,38=10.72, p<0.01; t(11)=13.06, p<0.05 and t(10)=11.43, p<0.05, respectively, Dunn's post hoc tests). There were no differences in total exploration time between the groups at training Kruskal-Wallis H2,38=0.61, p=0.98 or testing ANOVA F(2,30)=2.53, p=0.09. (f) Baf53b+/− het mice (n=9) exhibit impaired long-term OLM compared to wildtype mice (n=10; t-test t(17)=2.88, p<0.05). There was no difference in the overall exploration time between the groups at training t-test t(17)=0.60, p=0.56 or testing t-test t(17)=0.36, p=0.72. Mean (± SEM).
Figure 3
Figure 3
BAF53bΔHDlow and Baf53b+/− het mice have impairments in long-term memory for contextual fear, but normal cued fear memory. (a) During contextual fear training velocity (cm s−1) did not differ between BAF53bΔHDlow (n=10) and wildtype (n=9) mice for the five second prior to shock (Pre-Shock) nor during the shock (Shock) (Repeated Measures ANOVA F1,17=234.2, p<0.0001, bonferroni post hoc t-test pre-shock vs. post shock for wildtypes t-test t(8)=10.09, p<0.001 and BAF53bΔHDlow t-test t(9)=11.60, p<0.001, and no effect of genotype ANOVA F1,17=0.44, p=0.51 or interaction F1,17=0.44, p=0.51). (b) Animals were tested in the conditioned context 24 hours after conditioning. BAF53bΔHDlow mutant mice froze significantly less then wildtypes (t-test t(17)=3.46, p<0.05). At test there was a significant main effect of sex (ANOVA F1,15=12.39, p=0.003) but no interaction with genotype (F1,15=0.03, p=0.86) with males freezing more then females for BAF53bΔHDlow (bonferroni post hoc t-test t(9)=2.58, p<0.05) and a similar (but not significant) trend in wildtypes (bonferroni post hoc t-test t(8)=2.40, p>0.05). (c) 24hr memory test for cued fear conditioning (test in novel context). Both groups exhibited similar levels of freezing prior to tone onset (Pre-Tone) and after Tone onset (Tone) (Repeated Measures ANOVA F1,16=0.98, p=0.77), with a significant increase in freezing following tone onset in both groups (F1,16=38.21, p<0.0001, bonferroni post hoc t-test Pre-Tone vs. Tone for wildtype (n=8) t(7)=3.21, p<0.05 and BAF53bΔHDlow (n=10) t(9)=5.68, p<0.001). (D) Baf53b+/− het mice (n=9) have a normal response to the shock during contextual fear training compared to wildtype littermates (n=8) with a significant increase in velocity following shock for both groups (Repeated Measures ANOVA F1,15=183.3, p<0.0001), bonferroni post hoc t-test pre-shock vs. post shock for wildtype t(7)=8.38, p<0.001 and Baf53b+/− het mice t(8)=10.85, p<0.001, and no effect of genotype (F1,15=2.57, p=0.13) or interaction F1,15=1.80, p=0.20). (E) Baf53b+/− het mice froze significantly less then wildtypes at the 24hr long-term contextual fear memory test (t-test t(15)=2.25, p<0.05) (F) 24hr memory test for cued fear conditioning (test in novel context). Both groups exhibited similar levels of freezing prior to tone onset (Pre-Tone) and after Tone onset (Tone) (Repeated Measures ANOVA F1,22=0.53, p=0.48) with a significant increase in freezing following tone onset in both groups (ANOVA F1,22=63.29, p<0.0001, bonferroni post hoc t-test Pre-Tone vs. Tone for wildtype (n=12) t(11)=6.56, p<0.001 and Baf53b+/− het mice (n=12) t(11)=4.69, p<0.001). Mean (± SEM).
Figure 4
Figure 4
Hippocampal AAV-Baf53b rescues OLM but not ORM deficits in Baf53b+/− het mice. (a) Representative images of immunofluorescence of BAF53b (yellow) expression in wildtype and Baf53b+/− het mice with control (AAV-hrGFP) or AAV-Baf53b. Nuclei (blue) were counterstained with DAPI. Scale bar 200μm. (b) Mean intensity of BAF53b immunofluorescence from CA1 cell layer normalized to background (corpus collosum) and wildtype AAV-hrGFP. There is a complete return of BAF53b expression in CA1 of Baf53b+/− het mice to wildtype levels (ANOVA no main effect genotype F1,38=2.23, p=0.14, a main effect of virus F1,38=8.14, p<0.01, and a significant interaction F1,38=5.34, p<0.05). Bonferroni post hoc t-test WT vs. Baf53b+/− het mice for AAV-hrGFP t-test t(16)=2.5, p<0.05 and AAV-Baf53b t-test t(22)=0.62, p>0.05. WT AAV-hrGFP (n=10), WT AAV-Baf53b (n=12), Baf53b+/− het mice AAV-hrGFP (n=9), Baf53b+/− het mice AAV-Baf53b (n=12). (C) Schematic of behavioral testing. OLM was conducted as described in the methods. Following a five day rest period, animals then were habituated to a novel context and then underwent ORM training and testing. (D) Long-term Object Location Memory (OLM) (24hrs). There is a complete rescue of OLM in Baf53b+/− het mice with AAV-Baf53b (2-way ANOVA main effect genotype F1,40=4.49, p<0.05, virus F1,40=6.04, p<0.05, and no interaction F1,40=1.76 p=0.19). Bonferroni post hoc t-test WT vs. Baf53b+/− het mice for AAV-hrGFP t-test t(18)=2.33, p<0.05 and AAV-Baf53b t-test t(22)=0.59, p>0.05. There was no difference between any of the groups for total exploration at training (2-way ANOVA no effect genotype F1,40=3.56, p=0.07, virus F1,40=0.02, p=0.90, and no interaction F1,40=0.63 p=0.43) or testing (2-way ANOVA no effect genotype F1,40=0.29, p=0.59, virus F1,40=0.53, p=0.47, and no interaction F1,40=4.02 p=0.05). WT AAV-hrGFP (n=10), WT AAV-Baf53b (n=12), Baf53b+/− het mice AAV-hrGFP (n=10), Baf53b+/− het mice AAV-Baf53b (n=12). (E) Long-term Object Recognition Memory (ORM) (24hrs). There is a no rescue of ORM in Baf53b+/− het mice with AAV-Baf53b expression in dorsal hippocampus (2-way ANOVA main effect genotype F1,33=12.79, p<0.01, no main effect of virus F1,33=0.08 p=0.77, and no interaction F1, 33=0.16, p=0.69). Bonferroni post hoc t-test WT vs. Baf53b+/− het mice for AAV-hrGFP t-test t(14)=2.63, p<0.05 and AAV-Baf53b t-test t(19)=2.42, p<0.05). There was no difference between any of the groups for total exploration at training (2-way ANOVA no effect genotype F1,33=1.08, p=0.31, virus F1,33=2.85, p=0.10, and no interaction F1,33=0.04 p=0.84) or testing (2-way ANOVA no effect genotype F1,33=4.13, p=0.05, virus F1,33=1.78, p=0.19, and no interaction F1,33=0.51 p=0.48). WT AAV-hrGFP (n=7), WT AAV-Baf53b (n=10), Baf53b+/− het mice AAV-hrGFP (n=9), Baf53b+/− het mice AAV-Baf53b (n=11). Mean (± SEM).
Figure 5
Figure 5
BAF53bΔHD and Baf53b+/− het mice have disrupted LTP in hippocampal slices. (A, B) Simultaneous recordings of fEPSP slope from slices receiving baseline stimulation (control, grey circle) and 10 theta bursts (TBS) for wildtype (WT) (open circle) and Baf53b+/− het slices (green circle). Baf53b+/− het slices fail to maintain stable LTP (average for last 5min) t-test t(26)=6.48, p<0.0001. BAF53bΔHDlow slices produced stable potentiation similar to wildtype slices t(8)=0.30, p=0.79. (C) LTP induced with 5 theta bursts delivered to one of the two stimulation electrodes (control, grey circles) produced stable potentiation in wildtype slices (open circles) but not in BAF53bΔHDlow slices (green circles) t(13)=3.77, p<0.01. (D) Simultaneous recordings of fEPSP slope in slices receiving low-frequency stimulation (grey circles) and 10 theta bursts (open and green circles) in wildtype and BAF53bΔHDhigh slices t(22)=3.49, p<0.01. (E) Input/Output curves measuring the magnitude of the fEPSP response across a range of stimulation currents (10-50 μA) was comparable between Baf53b+/− het, BAF53bΔHDlow and wildtype slices, but not BAF53bΔHDhigh mice. (2-way Repeated ANOVA main effect genotype F3,35=4.47, p<0.01, time F8,35=246.7, p<0.0001, and significant interaction F24,35=2.01 p<0.005). For each stimulation current bonferroni post hoc t-test for wildtype (n=20) vs. Baf53b+/− het slices (n=6), wildtype (n=20) vs. BAF53bΔHDhigh slices (n=7), and wildtype (n=20) vs. BAF53bΔHDlow slices (n=6) are given in Supplemental FigS4. (**p<0.01; *p<0.05). (F) Input/Output curves compare amplitudes of the presynaptic fiber volley to the fEPSP amplitude across a range of stimulation currents. Left, Input/output curves were not different between Baf53b+/− het mice (n=6), BAF53bΔHDlow (n=6), and wildtype (n=6) (ANOVA F2,15=1.04, p=0.38). Right, The slope was significantly reduced in the Input/Output curve produced from BAF53bΔHDhigh slices (n=12) relative to wildtype (n=12) bathed in aCSF containing 3mM Mg+ and 1mM Ca2+ (Mann-Whitney U(22)=3.00, p<0.0001). (G) Paired pulse facilitation of the initial slope of the synaptic response was comparable (40, 60, 100, and 200 ms inter-pulse intervals) in slices from Baf53b+/− het (n=9), BAF53bΔHDlow (n=7), and wildtype mice (n=14) but not in BAF53bΔHDhigh slices (n=6) (2-way Repeated ANOVA main effect genotype F3,32=11.60, p<0.0001, interval F3,32=192.6, p<0.0001, and significant interaction F9,32=3.31 p<0.005). Bonnferoni post hoc comparisons in Supplemental FigS4 (***p<0.001; ** p<0.01; *p<0.05). (H) Top; sample traces of mini excitatory postsynaptic currents (mEPSCs) recorded from BAF53bΔHDhigh (n=14) and wildtype (n=15) neurons. Bottom; There were no differences in mEPSCs from BAF53bΔHDhigh and wildtype for the amplitude (left, t(27)=0.75, p=0.46) and frequency (right, t(27)=0.52, p=0.61) of the events in slices.
Figure 6
Figure 6
TBS induced phosphorylation (p) of Cofilin is altered in Baf53b+/− het mice. Adult mouse hippocampal slices are stimulated electrophysiologically and immunolabeled. (A) Immunocytochemical labeling of pCofilin (left) and PSD95-immunoreactive puncta (green) display some co-localization (Scale 2.5um). (B) Distribution of double labeled pCofilin intensities, show that Baf53b+/− het mice have a different baseline distribution, with an increase in the more intensely labeled puncta. (C) Cumulative probability distributions show that the Baf53b+/− het mice have curves that are shifted to the right relative to their wildtype counterparts, thus favoring the more intense puncta. (D) Bar graph shows values of double labeled puncta 7 minutes after control stimulation or TBS, with values normalized to respective control stimulation group. ANOVA main effect of stimulation F1,25=14.92, p<0.005, genotype F1,25=5.13, p<0.05, and a significant interaction F1,25=5.11, p<0.05. Bonnferoni corrected post hoc t-test wildtype control vs. TBS t(12)=4.24, p<0.001; Baf53b+/− het control vs. TBS t(13)=1.16, p>0.05 wildtype control (n=8), wildtype TBS (n=8), Baf53b+/− het control (n=7), Baf53b+/− het TBS (n=8). Mean +/- SEM. (E) Left Quantification of the mean volumes of PSD95-immuno reactive puncta that were colocalized with pCofilin for Baf53b+/− het mice (n=15) and wildtype littermates (n=16) t-test t(29)=1.39, p=0.19. Right Mean intensities of PSD95 labeled elements also show no difference between the Baf53b+/− het mice (n=15) and wildtype littermates (n=16) t-test t(29)=1.47, p=0.15. “n” refers to the number of images analyzed with ∼40,000 PSD95 immunoreactive puncta per image.
Figure 7
Figure 7
Differential gene expression in Baf53b+/− het mice by RNA Sequencing. (A) Gene expression diagram for wildtype compared to Baf53b+/− het mice mutant mice sacrificed directly from the homecage. (B) Gene expression for genes that increased or decreased expression following behavior (sacrificed 30min post training) compared to homecage. Genes with differential expression at homecage were removed prior to analysis. “Both” indicates genes regulated similarly in wildtype and Baf53b+/− het mice. “Unique Increase” comprises genes that increase in only the indicated genotype. “Unique Decrease” comprises genes that decrease in only the indicated genotype. Groups: Baf53b+/− het mice homecage (Baf53b+/− HC) (n=6); Baf53b+/− het mice Behavior (Baf53b+/− Beh) (n=6); wildtype homecage (WT HC) (n=6); and wildtype behavior (WT Beh) (n=6). Total gene counts for each genotype given above or below each column. (C) qRTP-PCR validation of the IEG c-fos. ANOVA main effect of behavior F1,20=157.6, p<0.0001, no effect of genotype F1,20=0.49, p=0.49, and no interaction F1,20=0.45, p=0.51. Expression relative to gapdh and normalized to wildtype homecage. (D) qRTP-PCR validation of the IEG Egr2. ANOVA main effect of behavior F1,20=224.2, p<0.0001, no effect of genotype F1,20=1.53, p=0.23, and no interaction F1,20=0.55, p=0.47. Expression relative to gapdh and normalized to wildtype homecage.

References

    1. Day JJ, Sweatt JD. Cognitive neuroepigenetics: a role for epigenetic mechanisms in learning and memory. Neurobiol Learn Mem. 2011;96:2–12. - PMC - PubMed
    1. Zahir FR, Brown CJ. Epigenetic impacts on neurodevelopment: pathophysiological mechanisms and genetic modes of action. Pediatr Res. 2011;69:92R–100R. - PubMed
    1. Hargreaves DC, Crabtree GR. ATP-dependent chromatin remodeling: genetics, genomics and mechanisms. Nature Publishing Group. 2011:1–25. - PMC - PubMed
    1. Wu JI, Lessard J, Crabtree GR. Understanding the Words of Chromatin Regulation. Cell. 2009;136:200–206. - PMC - PubMed
    1. Wang W, et al. Purification and biochemical heterogeneity of the mammalian SWI-SNF complex. The EMBO Journal. 1996;15:5370–5382. - PMC - PubMed

Publication types

MeSH terms

Associated data