Randomized Controlled Trial
. 2013 May;16(5):648-53.
doi: 10.1038/nn.3364. Epub 2013 Mar 24.

Dopamine restores reward prediction errors in old age

Affiliations
Randomized Controlled Trial

Dopamine restores reward prediction errors in old age

Rumana Chowdhury et al. Nat Neurosci. 2013 May.

Erratum in

  • Nat Neurosci. 2014 Dec;17(12):1840

Abstract

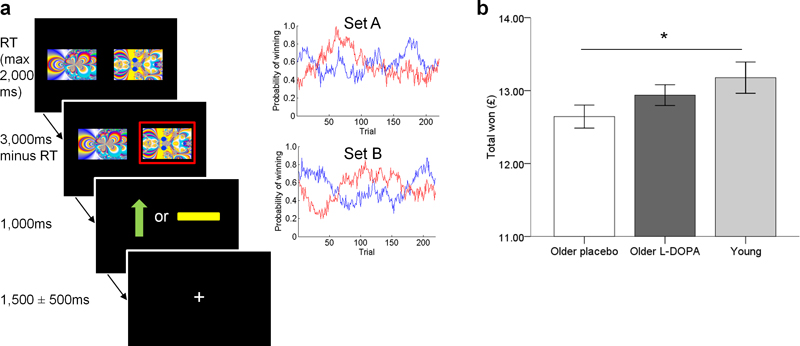
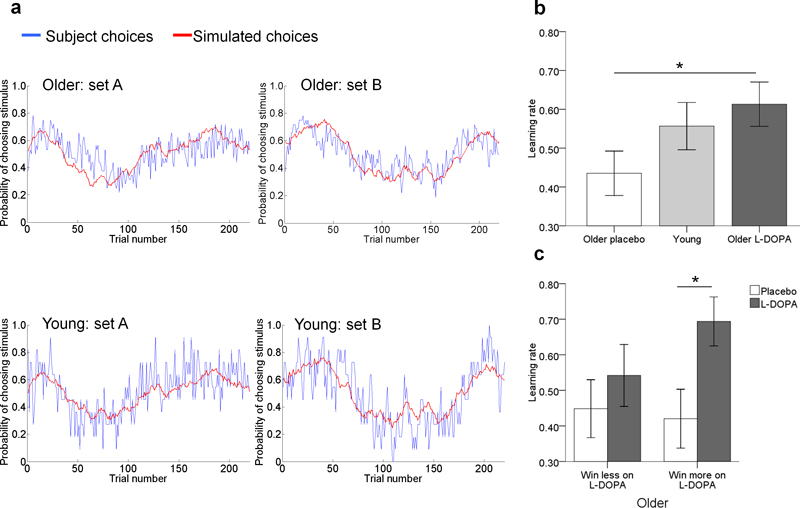
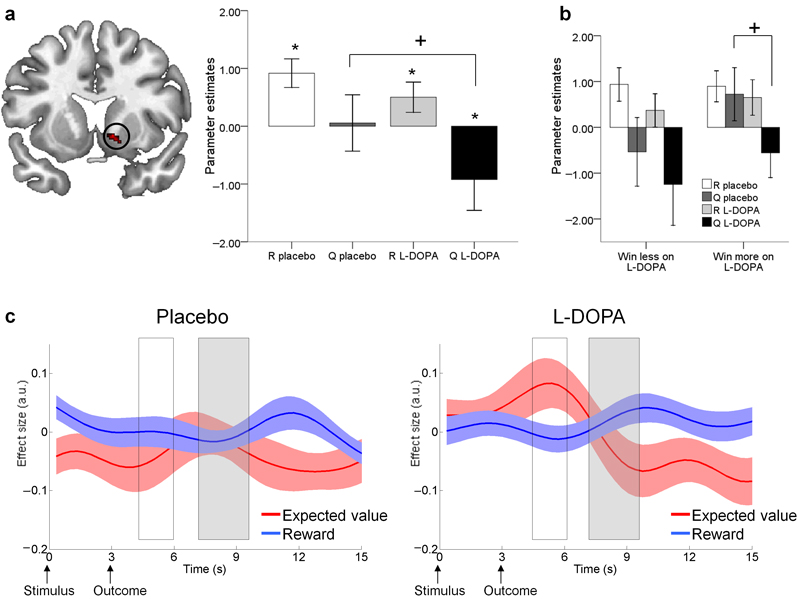
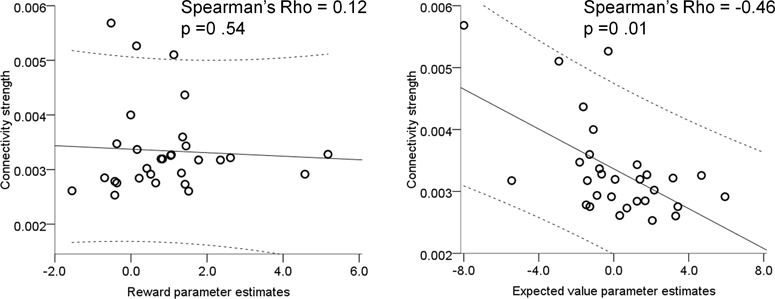
Senescence affects the ability to utilize information about the likelihood of rewards for optimal decision-making. Using functional magnetic resonance imaging in humans, we found that healthy older adults had an abnormal signature of expected value, resulting in an incomplete reward prediction error (RPE) signal in the nucleus accumbens, a brain region that receives rich input projections from substantia nigra/ventral tegmental area (SN/VTA) dopaminergic neurons. Structural connectivity between SN/VTA and striatum, measured by diffusion tensor imaging, was tightly coupled to inter-individual differences in the expression of this expected reward value signal. The dopamine precursor levodopa (L-DOPA) increased the task-based learning rate and task performance in some older adults to the level of young adults. This drug effect was linked to restoration of a canonical neural RPE. Our results identify a neurochemical signature underlying abnormal reward processing in older adults and indicate that this can be modulated by L-DOPA.


Figures

Figure 1
Figure 1. Two armed bandit task design and performance in young and older adults
a: On each trial, participants selected one of two fractal images which was then highlighted in a red frame. This was followed by an outcome where a green upward arrow indicated a win of 10 pence and a yellow horizontal bar indicated the absence of a win. If they did not choose a stimulus, the written message “you did not choose a picture” was displayed. The same pair of images was used throughout the task, although their position on the screen (left or right) varied. The task consisted of 220 trials separated into two sessions with a short break in between. Participants’ earnings were displayed at the end of the task and given to them at the end of the test day. The probability of obtaining a reward associated with each image varied on a trial-by-trial basis according to a Gaussian random walk. Two different sets of probability distributions (Set A and Set B) were used on the two testing days, counterbalanced across the order of L-DOPA/placebo administration. b: Older adults (n = 32) in the placebo condition won less money than young adults (n = 22). When the same older adults (n = 32) received L-DOPA, performance was similar to young adults. *p<0.05. Error bars indicate ±1SEM.
Figure 2
Figure 2. Reinforcement learning model and behaviour
a: For young and older adults, the predicted choices from the learning model (red) closely matched subjects’ observed choices (blue). The red lines show the same time-varying probabilities, but evaluated on choices sampled from the model (see methods). Plots are shown for the two different sets of probability distributions used on the two test days. b: Older adults (n = 32) had a higher learning rate under L-DOPA compared with placebo and did not differ from young adults (n = 22). *p<0.05 two-tailed. Error bars are ±1 SEM. c: Older adults who won more on L-DOPA than placebo (‘win more on L-DOPA’, n = 15) had a significantly higher learning rate under L-DOPA than placebo, whereas learning rates did not differ between placebo and L-DOPA for older adults who won less on L-DOPA than placebo (‘win less on L-DOPA’, n = 17). *p<0.05 two-tailed. Error bars are ±1 SEM.
Figure 3
Figure 3. Reward prediction in the nucleus accumbens in 32 older adults
a: A region in the right nucleus accumbens showed greater BOLD activity for reward (R) than for expected value (Q) at the time of outcome (‘putative’ reward prediction error). However, the lack of a negative effect of Q under placebo meant this prediction error signal was incomplete (*one sample t-test p<0.05 one-tailed). L-DOPA increased the negative effect of Q (paired t-test, +p < 0.05 two-tailed) resulting in a ‘canonical’ prediction error signal (both a positive effect of R and negative effect of Q). Bars ±1 SEM. b: Participants who ‘win more on L-DOPA’ (n = 15) only demonstrated a negative effect of Q under L-DOPA and not placebo (+paired t-test p < 0.05 two-tailed). R and Q parameter estimates did not differ between L-DOPA and placebo for participants who ‘win less on L-DOPA’, n = 17. Bars ±1 SEM. c: Time course plots of the nucleus accumbens BOLD response to reward and expected value. White box corresponds with BOLD responses elicited at the time participants’ made a choice; grey box corresponds with BOLD responses elicited when the outcomes were revealed. Under placebo the only reliable signal observed was a reward response. Under L-DOPA, a canonical reward prediction error was observed, involving a positive expectation of value at the time of the choice together with a positive reward response and a negative expectation of value at the time of the outcome. Reward anticipation (positive effect at the time of the choice) was only observed on L-DOPA. Solid lines are group means of the effect sizes, shaded areas represent ±1 SEM.
Figure 4
Figure 4. Nigro-striatal tract connectivity strength and functional prediction errors
Under placebo, individuals with higher white matter nigro-striatal tract connectivity strength (determined using DTI) had a more negative effect of expected value whereas there was no correlation with functional parameters estimates of reward. Each dot on the plots represents one subject (n = 30; note two participants are overlapping on the plot on the left), the solid line is the regression slope, dashed lines represent 95% confidence intervals.

Comment in

References

    1. Eppinger B, Hämmerer D, Li S-C. Neuromodulation of reward-based learning and decision making in human aging. Annals of the New York Academy of Sciences. 2011;1235:1–17. - PMC - PubMed
    1. Mell T, et al. Effect of aging on stimulus-reward association learning. Neuropsychologia. 2005;43:554–563. - PubMed
    1. Schultz W, Dayan P, Montague PR. A neural substrate of prediction and reward. Science. 1997;275:1593–1599. - PubMed
    1. Salamone JD, Correa M, Mingote SM, Weber SM. Beyond the reward hypothesis: alternative functions of nucleus accumbens dopamine. Current Opinion in Pharmacology. 2005;5:34–41. - PubMed
    1. Haber SN, Fudge JL, McFarland NR. Striatonigrostriatal Pathways in Primates Form an Ascending Spiral from the Shell to the Dorsolateral Striatum. J. Neurosci. 2000;20:2369–2382. - PMC - PubMed

Publication types