. 2013 May;14(5):500-8.
doi: 10.1038/ni.2556. Epub 2013 Mar 24.

Control of amino-acid transport by antigen receptors coordinates the metabolic reprogramming essential for T cell differentiation

Affiliations

Control of amino-acid transport by antigen receptors coordinates the metabolic reprogramming essential for T cell differentiation

Linda V Sinclair et al. Nat Immunol. 2013 May.

Erratum in

  • Nat Immunol. 2014 Jan;15(1):109

Abstract

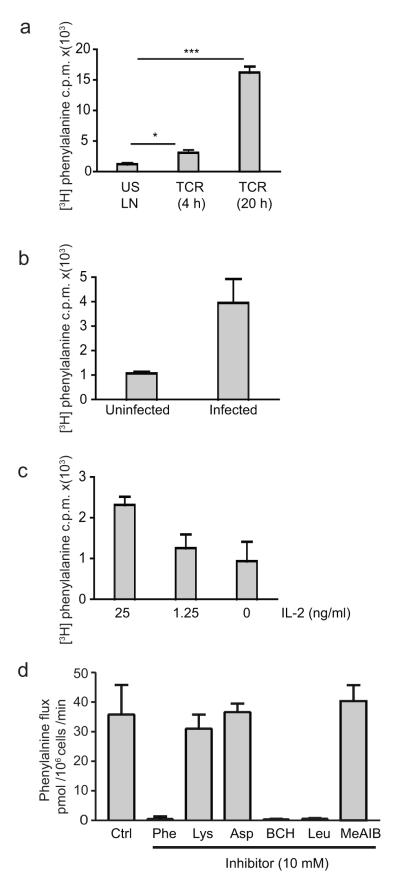
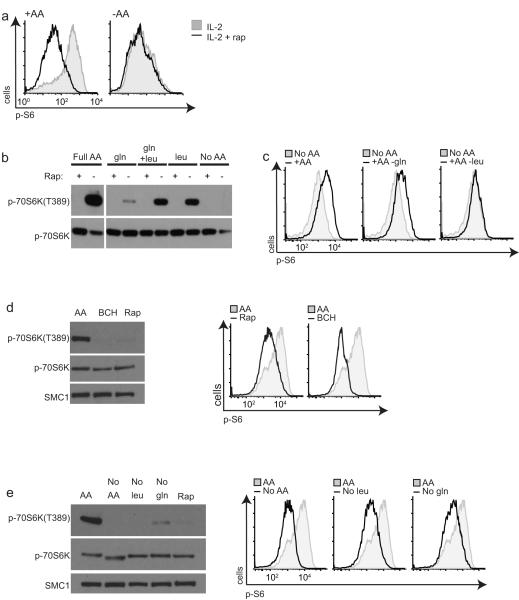
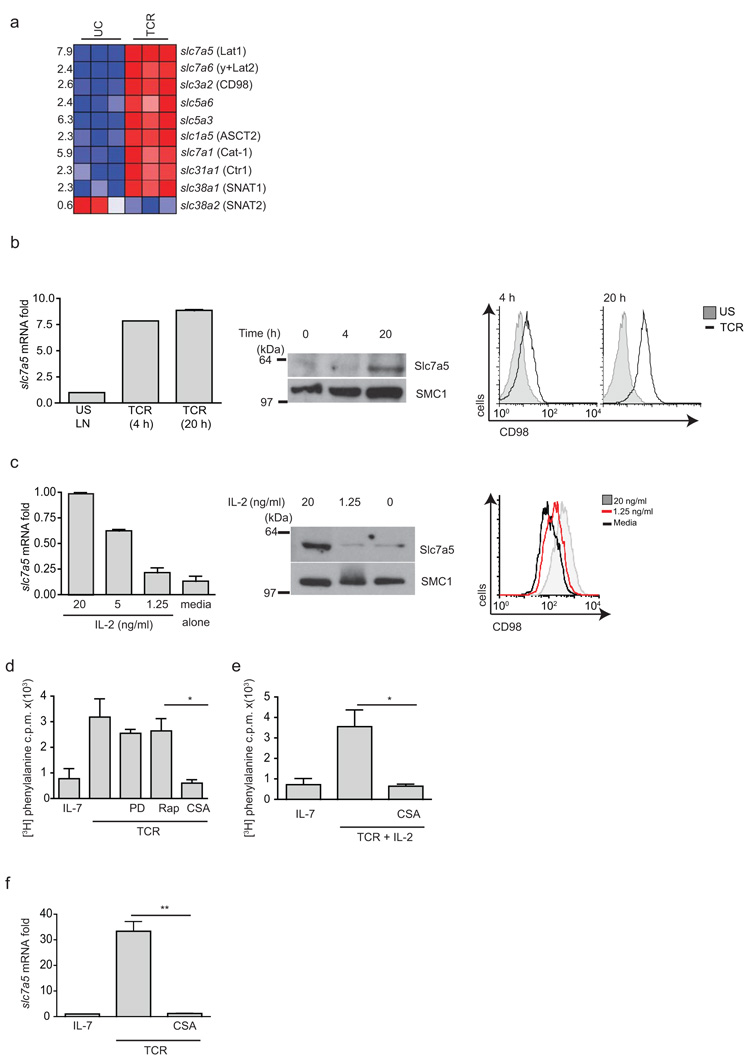
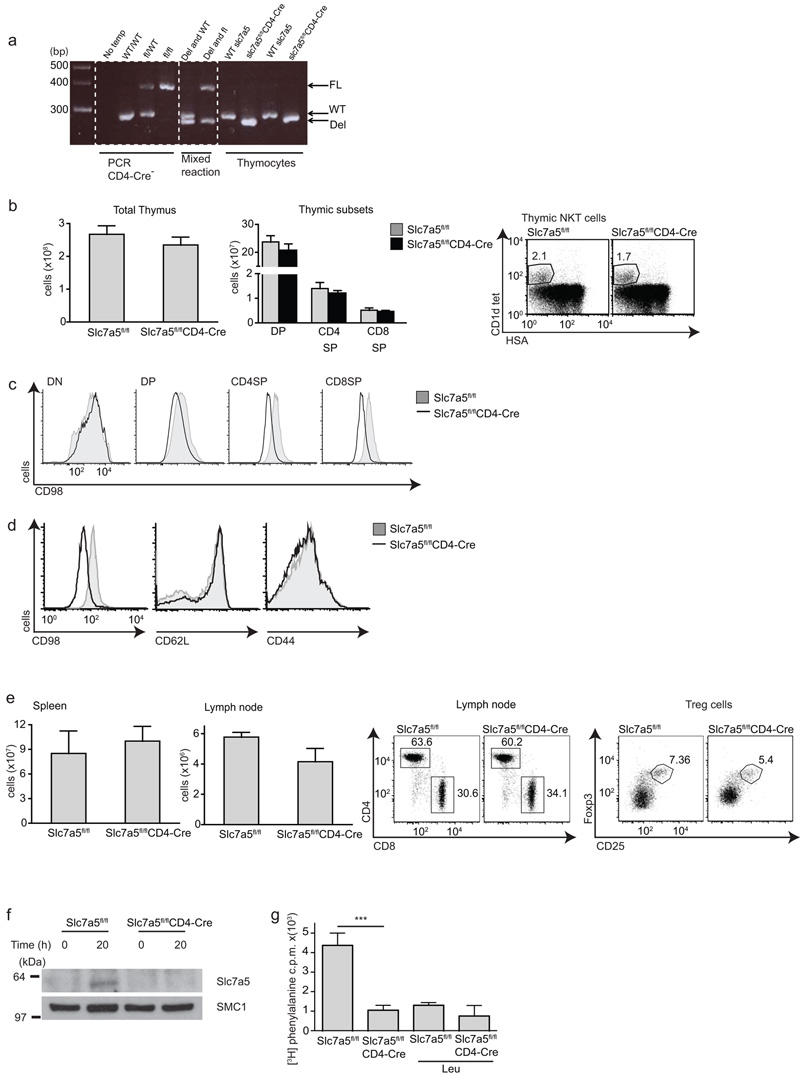
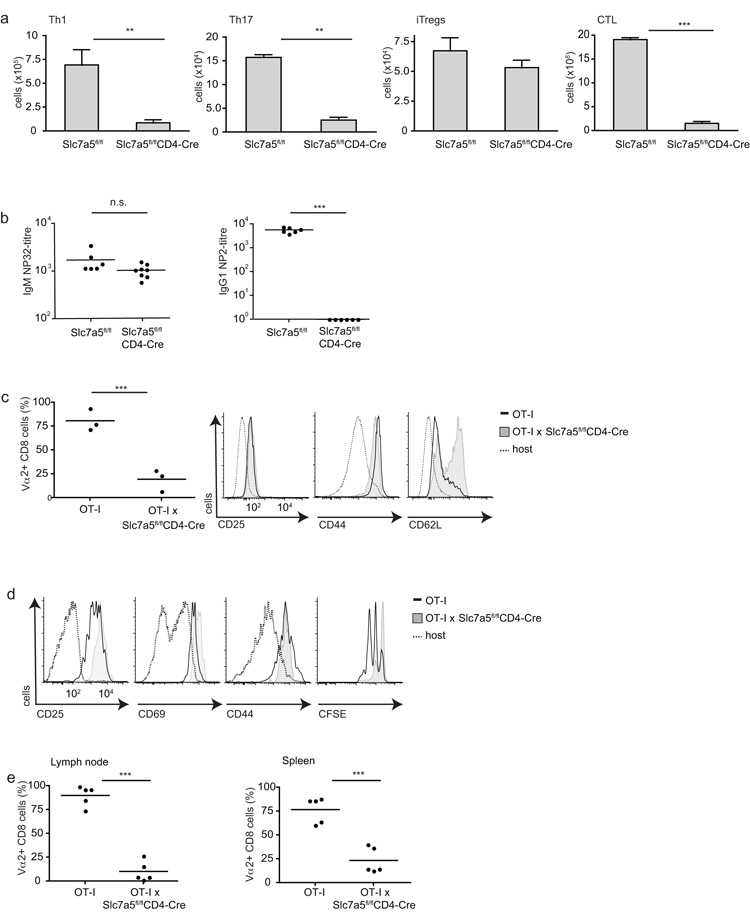
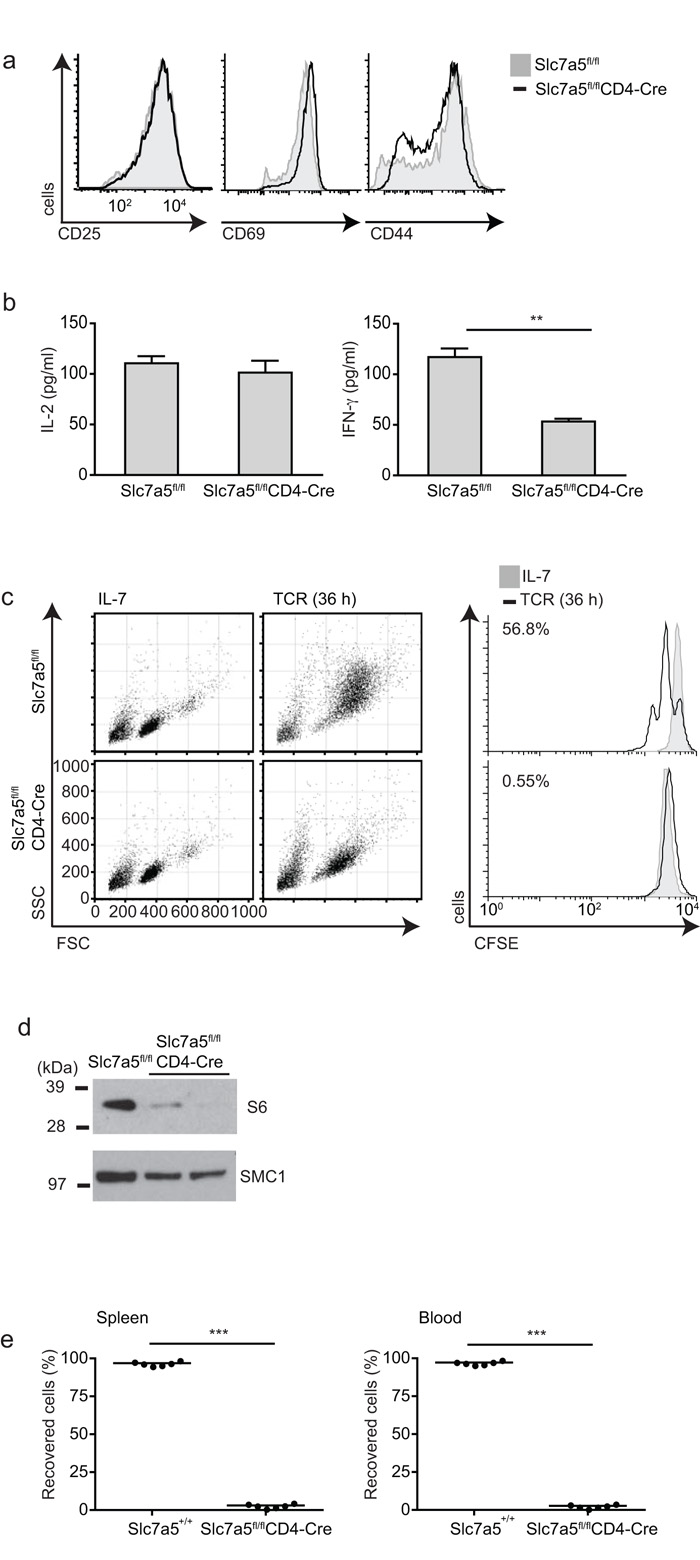
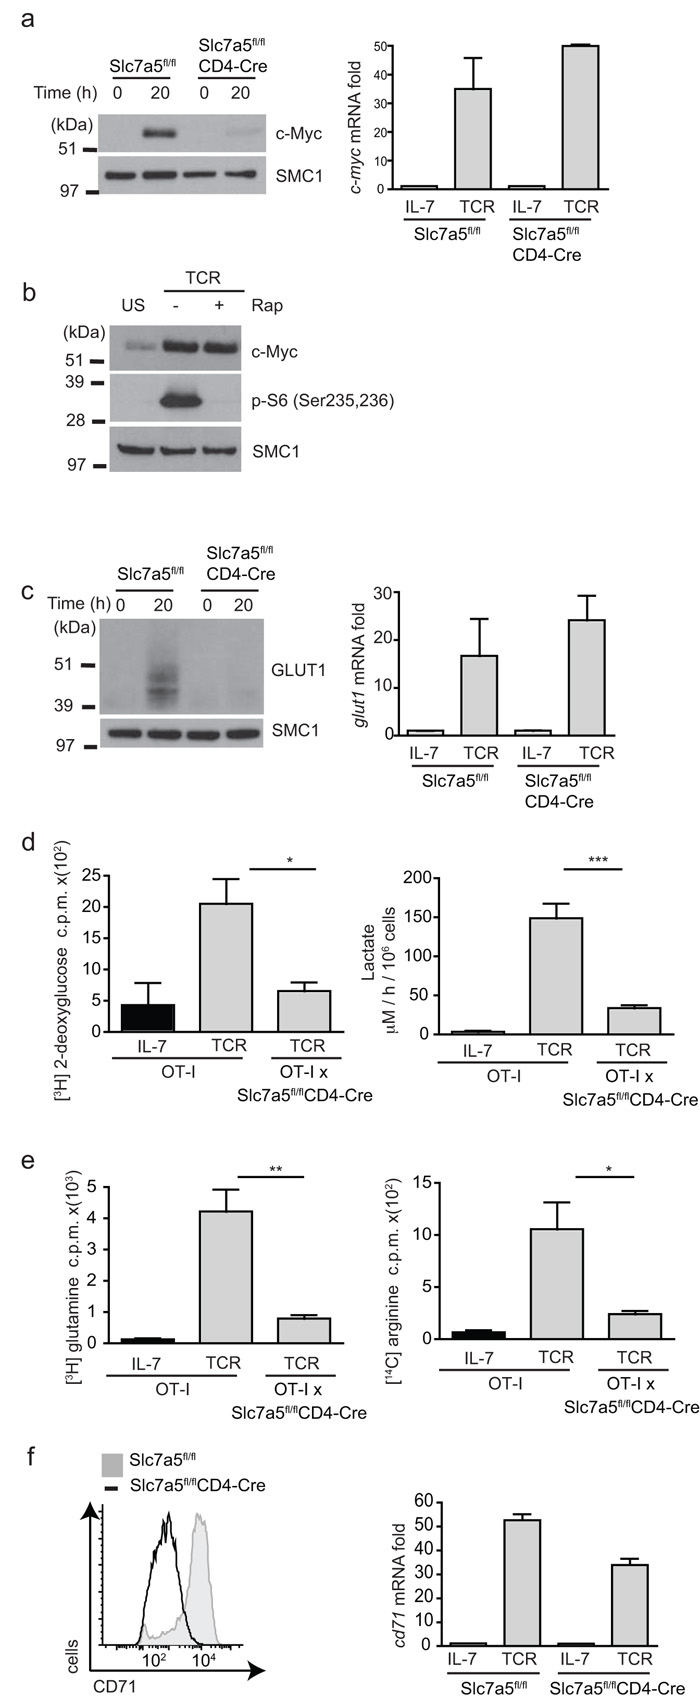
T lymphocytes must regulate nutrient uptake to meet the metabolic demands of an immune response. Here we show that the intracellular supply of large neutral amino acids (LNAAs) in T cells was regulated by pathogens and the T cell antigen receptor (TCR). T cells responded to antigen by upregulating expression of many amino-acid transporters, but a single System L ('leucine-preferring system') transporter, Slc7a5, mediated uptake of LNAAs in activated T cells. Slc7a5-null T cells were unable to metabolically reprogram in response to antigen and did not undergo clonal expansion or effector differentiation. The metabolic catastrophe caused by loss of Slc7a5 reflected the requirement for sustained uptake of the LNAA leucine for activation of the serine-threonine kinase complex mTORC1 and for expression of the transcription factor c-Myc. Control of expression of the System L transporter by pathogens is thus a critical metabolic checkpoint for T cells.


Figures

Figure 1
Figure 1. System L amino acid transport in CD8+ T cells
The data show 3H-phenylalanine uptake (c.p.m.) per 106 cells in (a) OT-I TCR transgenic lymph node cells cultured with IL-7 or stimulated with SIINFEKL for 4h (p=0.0147 )or 20 h p<0.0001. (b) Purified CD8+ T cells from Listeria-infected mice, 3 days post infection, and from uninfected mice. (c) Effector CTLs exposed to 20 ng/ml IL-2, 1.25 ng/ml IL-2 or medium alone for 20 h. (d) Phenylalanine flux (rate of Phe uptake) of IL-2 maintained CTLs in the presence of 10 mM cold amino acids; Phe, Lys, Asp or Leu, or in the presence of 10 mM of BCH or MeAIB. Data is from a minimum of 3 experiments done in triplicates (a, c and d), data in b is from 6 mice, 1 experiment.
Figure 2
Figure 2. Amino acids and mTORC1 in CD8+ T cells
(a) Flow cytometric analysis with antibodies to phospho-Ser235/236 of ribosomal S6 protein (p-S6) in CTLs in amino acid replete RPMI (left) or switched to amino acid-free HBSS (right) for 15 min +/− 20 nM rapamycin (Rap) for 15 min. (b) Immunoblot analysis with phospho-p70S6K(T389) (p-70S6K) or pan-p70S6K antibodies of CTLs deprived of amino acids for 30 mins then re-fed complete amino acids (RPMI), gln (2 mM), leu (0.4 mM), leu and gln for 30 min +/− Rapamcyin as indicated. (c) Flow cytometric analysis of p-S6 in CTLs deprived of amino acids in HBSS for 30 min, then re-fed with complete RPMI, glutamine-free RPMI or leucine-free RPMI for 30 min. (d) Immunoblot analysis (left) with phospho-70S6K(T389), pan-p70S6K or SMC1 antibodies in CTLs treated with inhibitors BCH (50 mM) or Rapamycin. Right, flow cytometric analysis with antibodies to p-S6 of the same samples. (e) Immunoblot analysis (left) phospho-p70S6KT389, pan-p70S6K or SMC1 antibodies in CTLs maintained in RPMI (AA) or switched to glutamine free RPMI, leucine free RPMI or treated with Rapamycin for 1 h. Right, flow cytometric analysis with p-S6 antibodies of the same samples. Data are representative of 3 experiments.
Figure 3
Figure 3. Regulation of System L amino acid transporters in T cells
(a) Fold induction of mRNA expression of the indicated nutrient transporters in naïve P14 CD8+ T cells versus 4h TCR stimulated cells (3 mice per group). (b) Relative Slc7a5 mRNA levels from RTPCR analysis of OT-I lymph node cells stimulated with SIINFEKL for 4 or 20 h (left) immunoblot analysis of Slc7a5 protein expression (middle), and CD98 surface expression by flow cytometry (right) of the same samples. (c) Left, Relative Slc7a5 mRNA levels from RTPCR analysis of IL-2 maintained CTLs exposed to 20 or 1.25 ng/ml IL-2 or media alone for 20 h; immunoblot analysis of Slc7a5 protein expression (center) and CD98 surface expression by flow cytometry (right) of the same samples. (d,e) 3H-phenylalanine uptake by OT-I T cells TCR-stimulated 18 h +/− inhibitors PD184352 (2 μM), rapamycin (20 nM) or CyclosporinA (CsA) (100 nM) p=0.0242 (d) and (e) IL-2 (20 ng/ml) +/− CsA compared to IL-7–maintained cells p=0.0246. (f) RTPCR of Slc7a5 gene expression in OT-I T cells TCR-stimulated +/− CsA (100 nM) compared to IL-7–maintained OT-I T cells p=0.0070. (b,c) Data are representative of 3 experiments in triplicates; (d-f) 2 collated experiments. SMC1 is loading control for immunoblots.
Figure 4
Figure 4. Slc7a5fl/flCD4-Cre mice
(a) PCR analysis of genomic DNA isolated from the indicate thymocytes showing Slc7a5 floxed (FL), wild-type (WT) and deleted (DEL) PCR products. (b) Thymocyte (left) and thymocyte subset (middle) numbers of Slc7a5fl/fl and Slc7a5fl/flCD4-Cre mice, the right panel shows flow cytometric analysis of NKT cells from the indicated mice (c) CD98 in thymic subsets. (d,e) Cellular analysis of spleen and lymph node from Slc7a5fl/fl and Slc7a5fl/flCD4-Cre mice. (d) Flow cytometry analysis of CD98, CD62L and CD44 levels in lymph node T cells. (e) Total numbers of spleen (left) and brachial lymph node cells (center left). Flow cytometry analysis of CD4 and CD8 expression by lymph node T cells (center right) or Foxp3 and CD25 expression by splenic T cells (right). (f) immunoblot analysis with Slc7a5 antibodies of naïve and 20 h TCR stimulated Slc7a5fl/fl and Slc7a5fl/flCD4-Cre CD8+ T cells. (g) 3H-phenylalanine uptake by Slc7a5fl/fl and Slc7a5fl/flCD4-Cre CD8+ TCR stimulated (20 h) T cells, p=0.0003. Uptake performed in the presence or absence of cold competitor 10 mM Leu to quench. (b-e). Representative data from 8-12 week mice, 3 mice per group; (f) representative of 3 experiments. SMC1 is loading control. (g) 3 mice per group.
Figure 5
Figure 5. Effector cell differentiation of Slc7a5fl/flCD4-Cre T cells
(a) Data show numbers of in vitro differentiated effector T cells from Slc7a5fl/fl and Slc7a5fl/flCD4-Cre spleen T cells: Th1 (left) p=0.0041, Th17 (center left) p=0.0044, inducible T regs (center right) or CTL (far right) p<0.0001. (b) Slc7a5fl/fl and Slc7a5fl/flCD4-Cre were immunized with T cell-dependent antigen NP-OVA. Serum antibody endpoint titers of NP-32 specific IgM antibodies (left) p=0.0684 and NP-2 specific IgG1 antibodies (right) p<0.0001 day 7 post-immunization. (c-e) OT-I and OT-IxSlc7a5fl/flCD4-Cre lymph node cells were mixed 1:1, CFSE-labelled and co-injected into C57BL/6Ly5.1 hosts. Mice were then immunized with LPS and SIINFEKL. (c) Analysis of transferred cells recovered from spleens 7 days after immunization. Left, ratios of OT-I CD8+ Vα2 cells, right panels show surface expression of activation markers on OT-I CD8+ Vα2 cells. (d) Analysis of CD25, CD69, CD44 and CFSE on OT-I CD8+ Vα2 cells recovered after 48 h, 2 independent experiments, 5 mice. (e) The ratios of OT-I CD8+ Vα2 cells recovered from lymph node p<0.0001 and spleen p=0.0003 after 48 h. (a) collated data from at least 3 experiments in triplicates; (b-e) each data point represents one mouse.
Figure 6
Figure 6. Activation and proliferation of Slc7a5fl/flCD4-Cre T cells
OT-I Slc7a5fl/fl and OT-IxSlc7a5fl/flCD4-Cre lymph node cells were stimulated through the TCR. (a) Cell surface expression of CD25, CD69 and CD44 on CD8+ T cells, and (b) the amount of IL-2 (left) and IFN-γ (right) produced after 20 h TCR stimulation. (c) Forward- and side-scatter profiles of CD8+ T cells after 36 h activation are shown compared to unstimulated cells maintained in IL-7 (left) and CFSE dilution (right). (d) Immunoblot analysis of total ribosomal S6 protein of CD8+ T cells after 20 h activation. (e) Slc7a5+/+ (CD45.1) and Slc7a5fl/flCD4-Cre (CD45.2) T cells were mixed at a ratio of 1:1 and adoptively transferred into Rag2−/− hosts. The graphs show percentage of recovered Slc7a5+/+ and Slc7a5fl/flCD4-Cre T cells in spleen and blood 14 days after adaptive transfer. Each data point represents data from one mouse. a, c, d data are representative of at least 3 experiments. (b) n = 3 mice per group, 1 independent experiment, triplicate samples, p=0.0019. (e) n=3 mice per group, 2 independent experiments, p<0.0001.
Figure 7
Figure 7. Metabolic consequences of Slc7a5 deletion in T cells
(a) Immunoblot analyses with c-Myc antbodies (left) and real-time PCR gene expression of c-Myc mRNA in OT-I and OT-Ix Slc7a5fl/flCD4-Cre CD8 T cells stimulated with SIINFEKL for 20h. (b) Immunoblot analyses with c-Myc and p-S6(Ser235,6) antisera in OT-I and OT-Ix Slc7a5fl/flCD4-Cre lymph node T cells stimulated with SIINFEKL for 20h with and without rapamycin (rap) treatment. (c) Immunoblot analysis with Glut1 antibodies (left) and Glut1 mRNA levels( right) in OT-I and OT-Ix Slc7a5fl/flCD4-Cre lymph node T cells stimulated with SIINFEKL for 20h. (d) 3H-2-deoxy-glucose uptake (left), p=0.0239 and lactate output (right), p=0.0002 in OT-I and OT-Ix Slc7a5fl/flCD4-Cre lymph node T cells. (e) 3H glutamine (left), p=0.0086 and 14C arginine (right) uptake, p=0.0358 in OT-I and OT-Ix Slc7a5fl/flCD4-Cre lymph node T cells stimulated with SIINFEKL for 20h. (f) Flow cytometry analysis with CD71 antibodies on CD8+ T cells (left) and CD71 mRNA expression in OT-I and OT-Ix Slc7a5fl/flCD4-Cre lymph node T cells stimulated with SIINFEKL for 20h (right). (a,b,e) data is representative of 3 experiments; (c,d) 3 mice per group. All samples done in triplicates. SMC1 is shown as a loading control.

Comment in

References

    1. Wang R, Green DR. Metabolic checkpoints in activated T cells. Nat. Immunol. 2012;13:907–915. - PubMed
    1. Carr EL, et al. Glutamine uptake and metabolism are coordinately regulated by ERK/MAPK during T lymphocyte activation. J. Immunol. 2010;185:1037–1044. - PMC - PubMed
    1. Beugnet A, Tee AR, Taylor PM, Proud CG. Regulation of targets of mTOR (mammalian target of rapamycin) signalling by intracellular amino acid availability. Biochem. J. 2003;372:555. - PMC - PubMed
    1. Schriever SC, Deutsch MJ, Adamski J, Roscher AA, Ensenauer R. Cellular signaling of amino acids towards mTORC1 activation in impaired human leucine catabolism. The Journal of Nutritional Biochemistry. 2012 doi:10.1016/j.jnutbio.2012.04.018. - PubMed
    1. Zheng Y, Delgoffe GM, Meyer CF, Chan W, Powell JD. Anergic T Cells Are Metabolically Anergic. J. Immunol. 2009;183:6095–6101. - PMC - PubMed

Publication types

MeSH terms

Substances

Associated data