. 2013 May;41(9):4813-24.
doi: 10.1093/nar/gkt180. Epub 2013 Mar 21.

A novel bifunctional histone protein in Streptomyces: a candidate for structural coupling between DNA conformation and transcription during development and stress?

Affiliations

A novel bifunctional histone protein in Streptomyces: a candidate for structural coupling between DNA conformation and transcription during development and stress?

Matthew Aldridge et al. Nucleic Acids Res. 2013 May.

Abstract

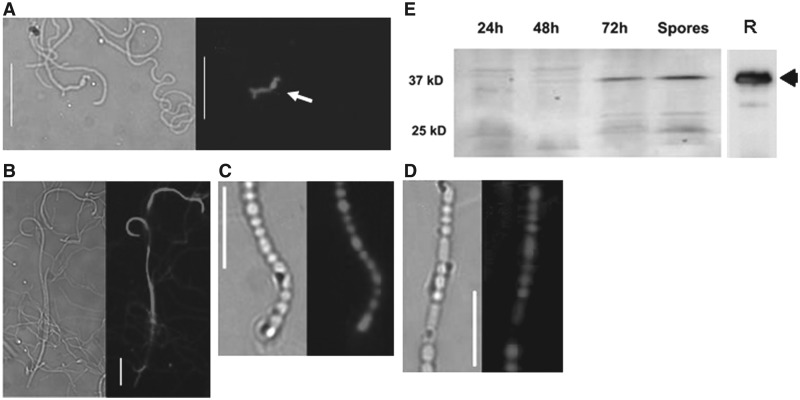
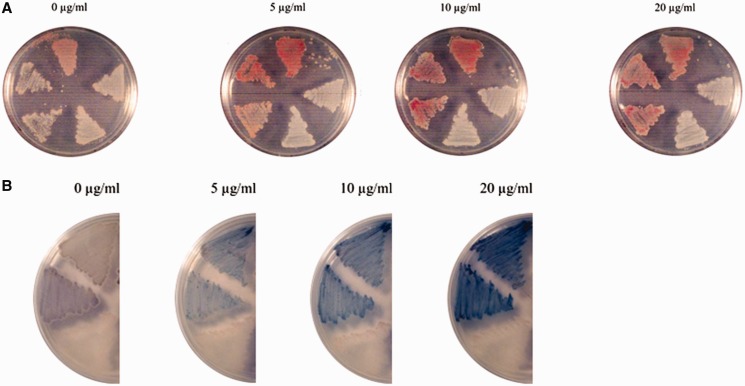
Antibiotic-producing Streptomyces are complex bacteria that remodel global transcription patterns and their nucleoids during development. Here, we describe a novel developmentally regulated nucleoid-associated protein, DdbA, of the genus that consists of an N-terminal DNA-binding histone H1-like domain and a C-terminal DksA-like domain that can potentially modulate RNA polymerase activity in conjunction with ppGpp. Owing to its N-terminal domain, the protein can efficiently bind and condense DNA in vitro. Loss of function of this DNA-binding protein results in changes in both DNA condensation during development and the ability to adjust DNA supercoiling in response to osmotic stress. Initial analysis of the DksA-like activity of DdbA indicates that overexpression of the protein suppresses a conditional deficiency in antibiotic production of relA mutants that are unable to synthesise ppGpp, just as DksA overexpression in Escherichia coli can suppress ppGpp(0) phenotypes. The null mutant is also sensitive to oxidative stress owing to impaired upregulation of transcription of sigR, encoding an alternative sigma factor. Consequently, we propose this bifunctional histone-like protein as a candidate that could structurally couple changes in DNA conformation and transcription during the streptomycete life-cycle and in response to stress.


Figures

Figure 1.
Figure 1.
DdbA is a DNA-binding protein as revealed by EMSA. Panel A: Lane 1 contain 300 ng pUC18 supercoiled DNA substrate in the absence of protein, lane 2: 1 μg BSA, lane 3: 1 μg BSA and 300 ng DNA, lane 4: 1 μg DdbA. Lanes 5 and 6 contain pUC18 substrate DNA with DdbA in a range of 0.1, 0.25, 0.5, 0.75 and 1 μM of protein. The open triangle on the top of the gel image indicates DdbA protein concentration range used. Panel B: Reactions were performed with 300 ng of pUC18 as substrate DNA in the absence of protein (lane 1) or in the presence of 0.25, 0.5 0.75 or 1 μM of DdbA-NTD protein (lanes 2–5). The open triangle on the top of the gel image denotes increasing concentrations of the protein. Panel C: All lanes contain 300 ng supercoiled plasmid pUC18 substrate DNA and respectively no protein (lane1), 1 μM DdbA-CTD protein (lane 2), 1 μM full-length DdbA protein (lane 3) and 1.8 μM DdbA-CTD protein (lane 4).
Figure 2.
Figure 2.
DdbA is a developmentally regulated NAP. Panel A: DdbA::mCherry is present in a germinating spore (arrowed) and in a small region of the adjacent young aerial hyphae. Panel B: DdbA::mCherry is subsequently expressed in non-branching aerial hyphae. Panel C: DdbA::mCherry co-localizes with nucleoids in spore compartments. Panel D: little or no fusion protein was detected in nucleoid-free spore compartments of an smc mutant. Bars indicate 10 µm. Panel E: total protein extracts from S.coelicolor M145/ p2075His grown on the surface of SFM plates were collected and immunobloted. Spores were collected after 4 days, filtered through cotton and a total protein extract prepared. In all, 10 mg of total protein were loaded in each of the first four lanes. Adjacent panel (R) shows purified recombinant DbdAHis expressed in E.coli BL21 (DE3), and detected as above.
Figure 3.
Figure 3.
DdbA contributes to nucleoid condensation during sporulation. Panel A: representative images of live-stained nucleoids from S.coelicolor M145 and the ddbA mutant. Bars indicate 10 µm. Panel B: histogram showing distribution of nucleoid sizes in these strains (a minimum of 400 nucleoids measured per strain). The histogram was generated by plotting the percentage of nucleoids per 0.1 mm size intervals, across the 0.1–3 mm size interval.
Figure 4.
Figure 4.
In vitro condensation of plasmid DNA by DdbA. Panel A: Atomic Force Microscopy image (Height) of DdbA bound to circular pUC18 plasmid. Panel B shows enlargements of a large-, an intermediate- and a smaller-sized protein–DNA aggregate. Panel C illustrates circular pUC18 (negative control).
Figure 5.
Figure 5.
The ddbA is involved in the osmotic stress response. Panel A: increased production of blue actinorhodin as a result of osmotic stress was evident with surface grown cultures of the ddbA mutant (1) and the mutant with an empty vector, pSH152 (2), compared with the genetically complemented mutant containing plasmid pSH2075 (3). The wild-type strain, M145 is also shown for comparison. M145 containing pSH152, not shown, has a similar phenotype to the plasmid-free wild-type strain. The strains were grown on NMMP medium containing 250 mM KCl. Panel B: qRT-PCR quantifying ddbA transcript abundance before and after of osmotic up-shock with 250 mM KCl. S.coelicolor M145 was grown for 16 h on cellophane discs on the surface of MS agar and then transferred to MS/250 mM KCl plates and incubated for 1 h before total RNA extraction. A non-stressed control sample was processed in parallel by transfer of a cellophane disc to an MS plate, followed by 1 h incubation. The data represent averages obtained from three biological replicates, with three experimental replicates performed on each sample.
Figure 6.
Figure 6.
DdbA modulates DNA supercoiling. For panels A and B, plasmid pROT219 DNA was extracted and supercoils separated on chloroquine gels together with HindIII restricted λ DNA (lane M). Quantitation of the intensity of bands corresponding to individual topoisomers from each lane is shown next to each gel. Lkm, the most abundant topoisomer is indicated by the vertical arrow and the change in linking number, ΔLk is shown for each lane using plasmid isolated from M145 with no osmolyte (Panel A, lane 1) as a reference point. The horizontal arrow indicates direction of migration in gel. Panel A: Lanes 1 and 3—plasmid from M145 grown without and with 1 M sucrose; lanes 2 and 4—plasmid from the ddbA mutant grown without and with 1 M sucrose. Panel B: lane 1—plasmid from the M145 parental strain grown with 1 M sucrose; lane 2—plasmid from the genetically complemented ddbA mutant with integrated pSH2075 grown with 1 M sucrose. Panel C: qRT-PCR quantifying gyrB transcript abundance in strains M145 and the ddbA mutant before and after of osmotic up-shock with 250 mM KCl. S.coelicolor M145 was grown for 16 h on cellophane discs on the surface of MS agar and then transferred to MS/250 mM KCl plates and incubated for between 5 and 60 min before total RNA extraction. The data represent averages obtained from three biological replicates, with three experimental replicate performed on each sample.
Figure 7.
Figure 7.
Over-expression of DdbA restores antibiotic production in relA mutants. Strains were grown for 5 days on SMMS medium supplemented with indicated concentrations of the inducer, thiostrepton. Panel A: clockwise from top: M145 with the empty vector pIJ8600H; two independent relA mutants of M145 with the empty vector pIJ8600H; the same two relA mutants with plasmid pDksA3H. Panel B: the top two strains are two independent clones of M570relA with plasmid pDksA3; the bottom strain is M570relA with the empty vector pIJ8600.
Figure 8.
Figure 8.
Reduced induction of sigR expression in a ddbA mutant. The qRT-PCR analysis of sigR transcript abundance at 15 and 30 min after induction of thiol stress in M145 and the ddbA mutant. The data were normalized using hrdB as a control. Strains were grown over night on NMMP and transferred to minimal liquid medium (NMMP) + 0.5 mM diamide. The data represent averages obtained from three biological replicates, with three experimental replicate performed on each sample.

References

    1. Martin JF, Liras P. Engineering of regulatory cascades and networks controlling antibiotic biosynthesis in Streptomyces. Curr. Opin. Microbiol. 13:263–273. - PubMed
    1. McCormick JR, Flardh K. Signals and regulators that govern Streptomyces development. FEMS Microbiol. Rev. 36:206–231. - PMC - PubMed
    1. Hesketh A, Sun J, Bibb M. Induction of ppGpp synthesis in Streptomyces coelicolor A3(2) grown under conditions of nutritional sufficiency elicits actII-ORF4 transcription and actinorhodin biosynthesis. Mol. Microbiol. 2001;39:136–144. - PubMed
    1. Hesketh A, Chen WJ, Ryding J, Chang S, Bibb M. The global role of ppGpp synthesis in morphological differentiation and antibiotic production in Streptomyces coelicolor A3(2) Genome Biol. 2007;8:R161. - PMC - PubMed
    1. Potrykus K, Cashel M. (p)ppGpp: still magical? Annu. Rev. Microbiol. 2008;62:35–51. - PubMed

Publication types

MeSH terms