. 2013 Mar 22:4:128.
doi: 10.3389/fpsyg.2013.00128. eCollection 2013.

Human Object-Similarity Judgments Reflect and Transcend the Primate-IT Object Representation

Affiliations

Human Object-Similarity Judgments Reflect and Transcend the Primate-IT Object Representation

Marieke Mur et al. Front Psychol. .

Abstract

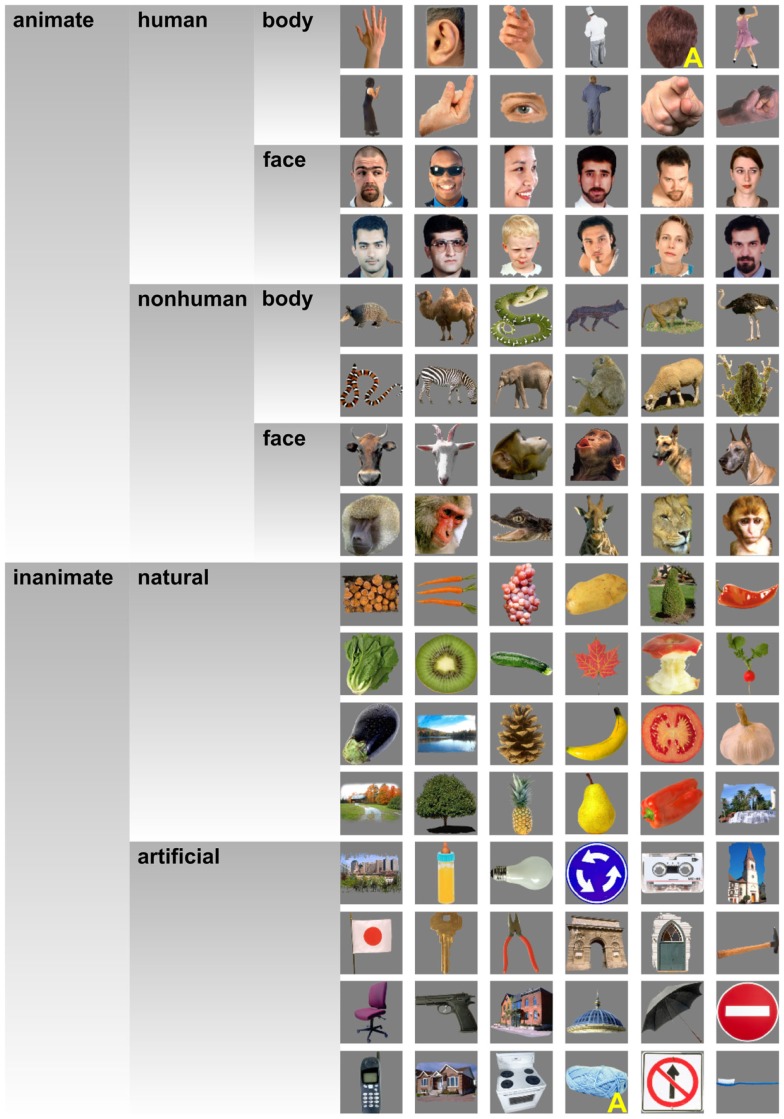
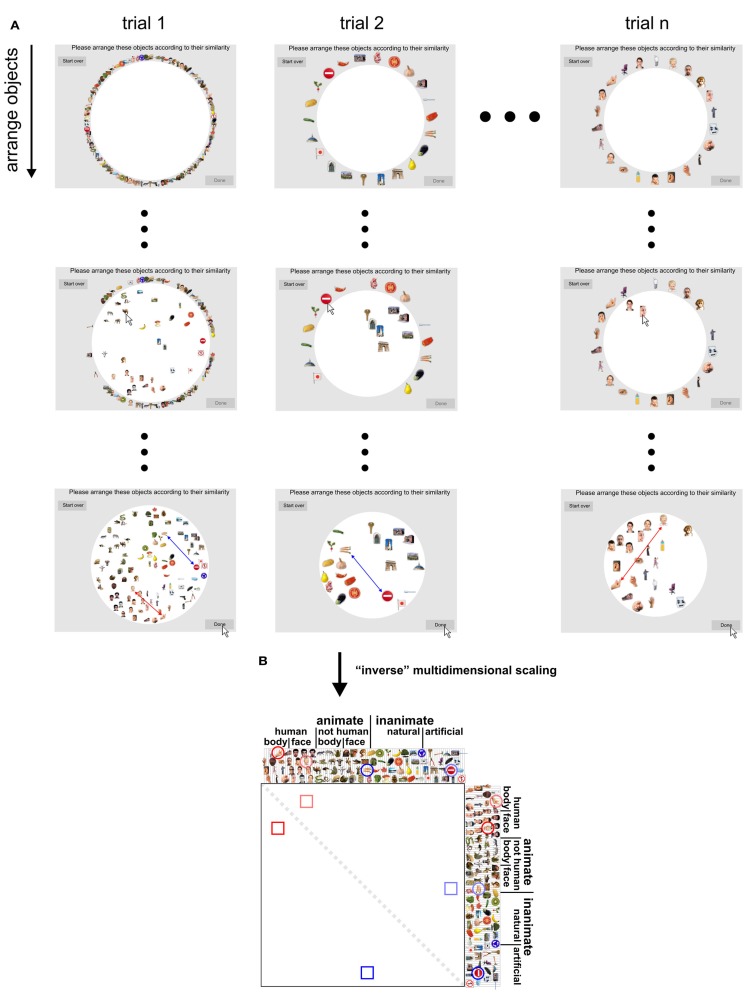
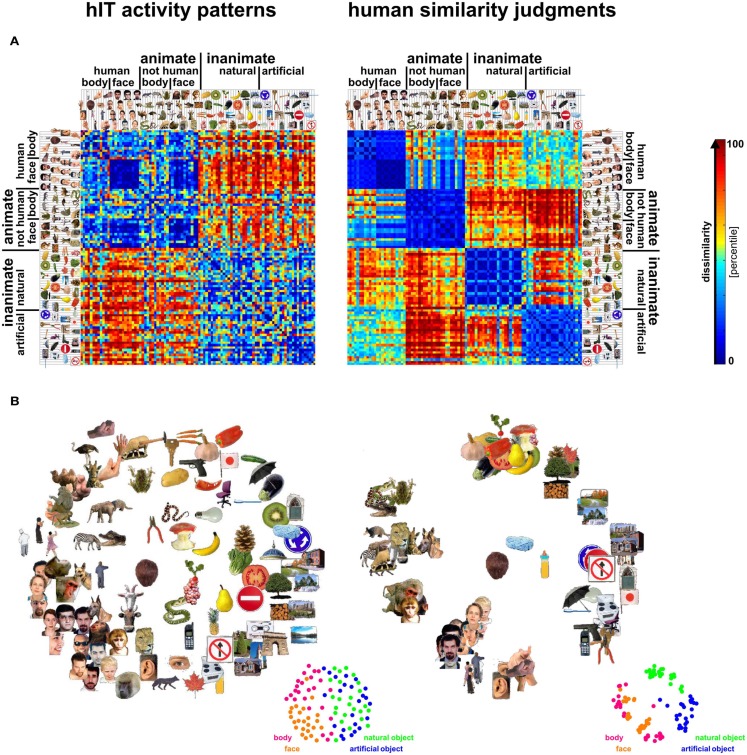
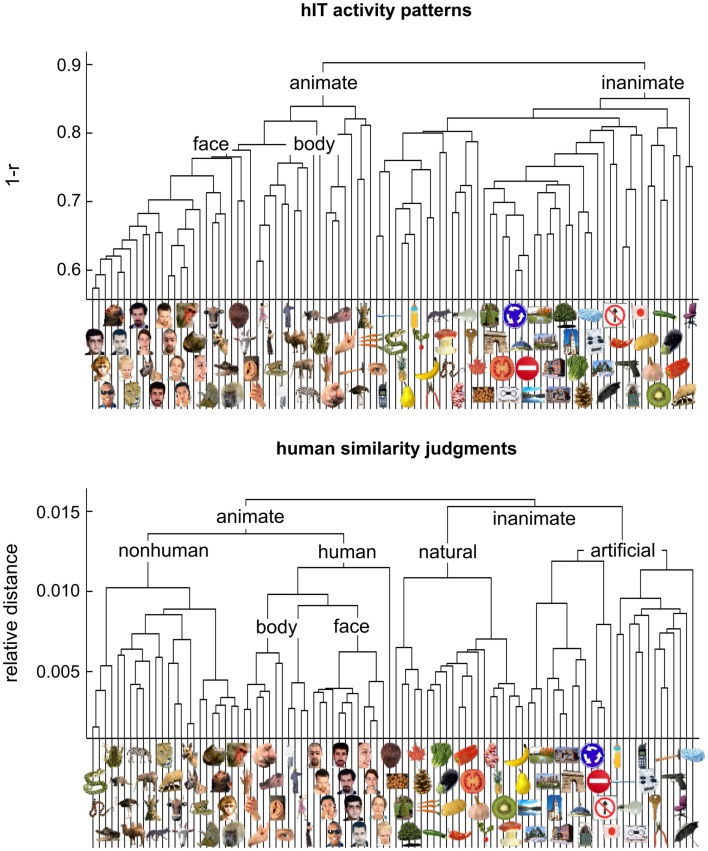
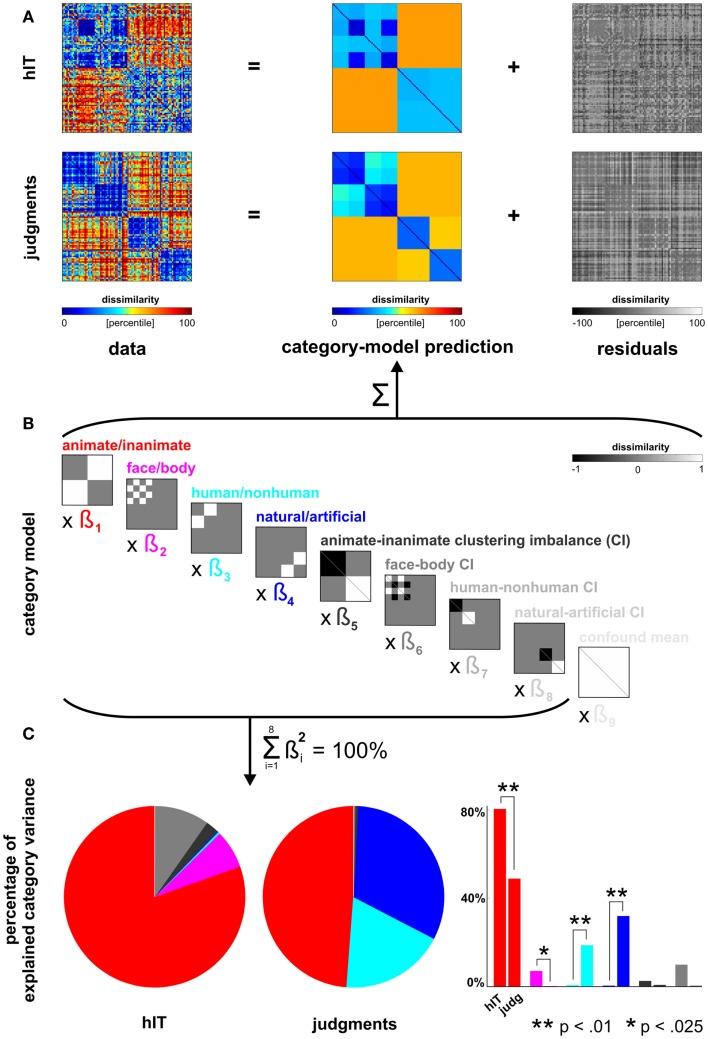
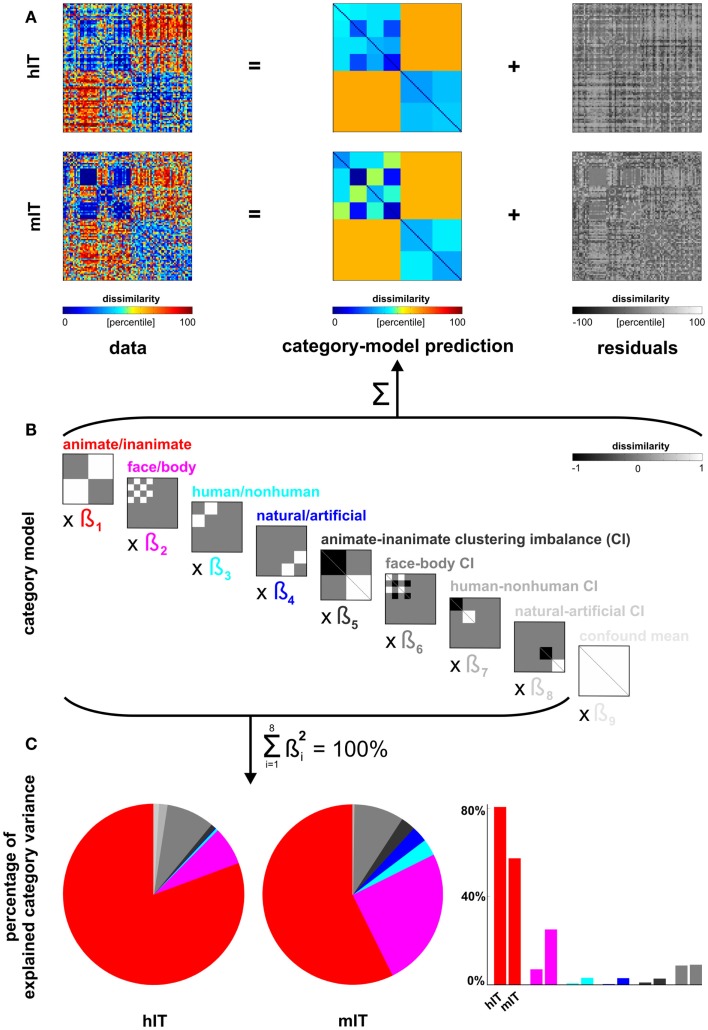
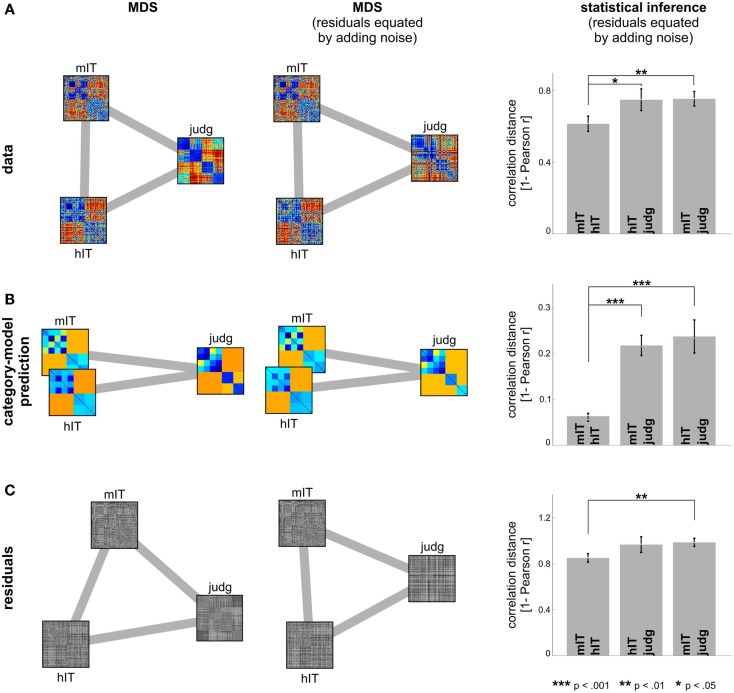
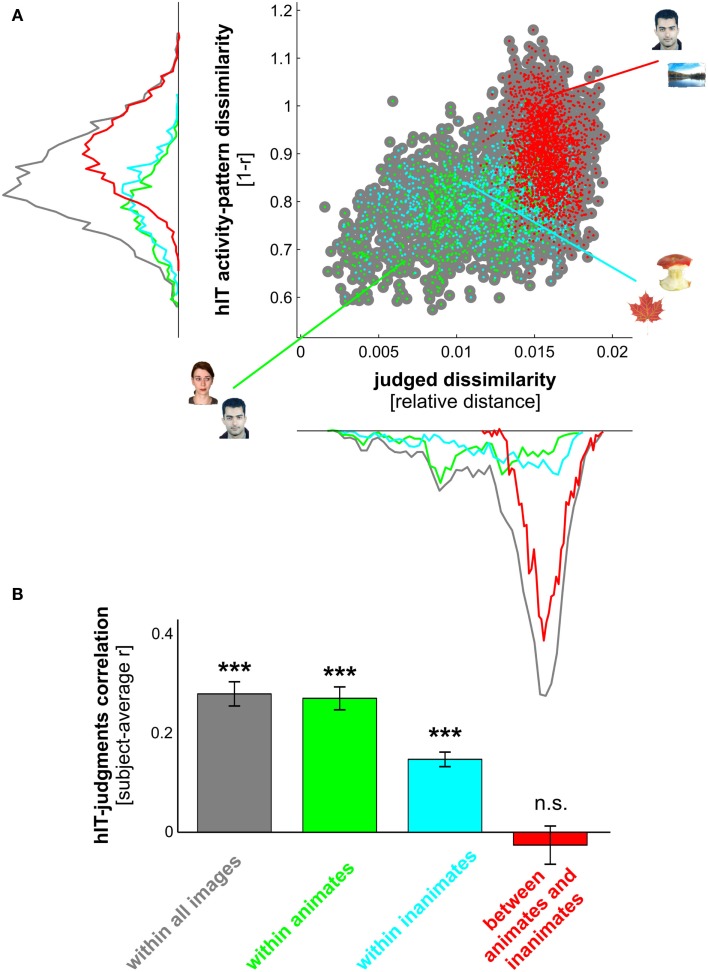
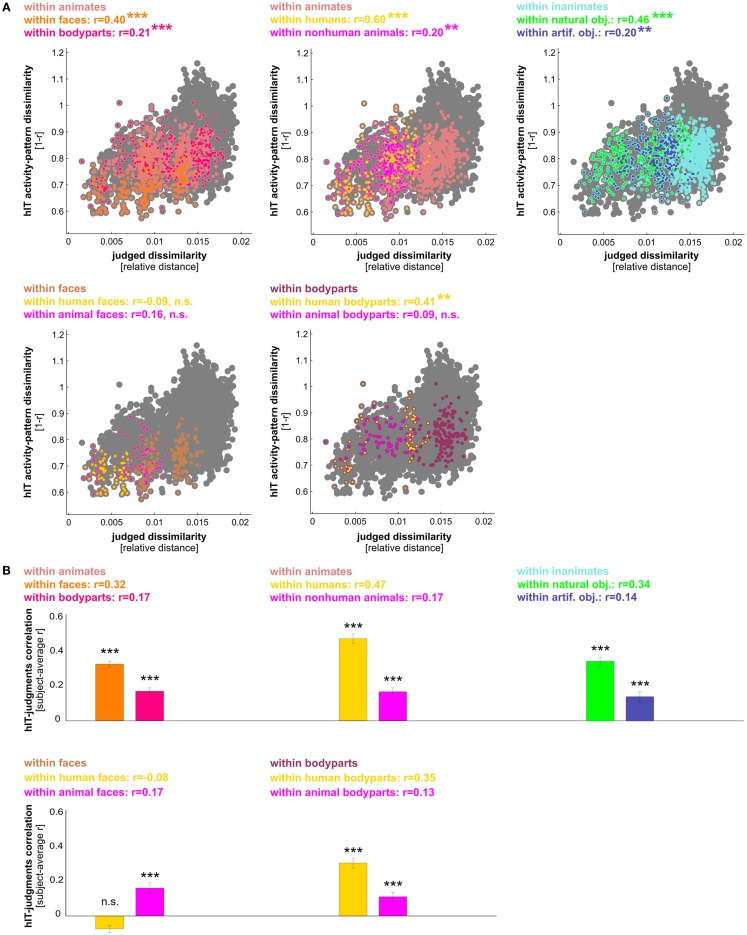
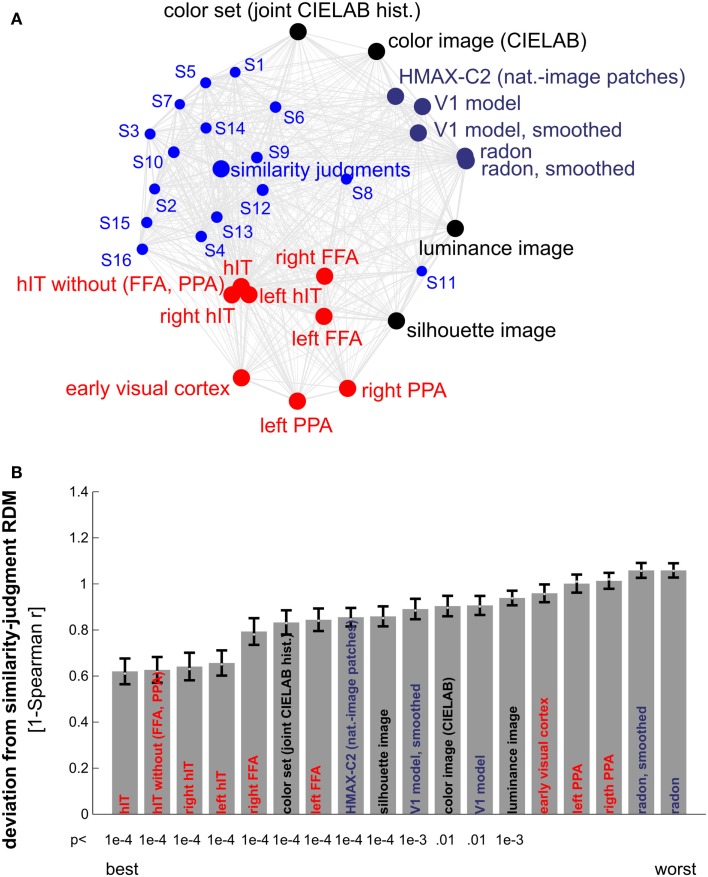
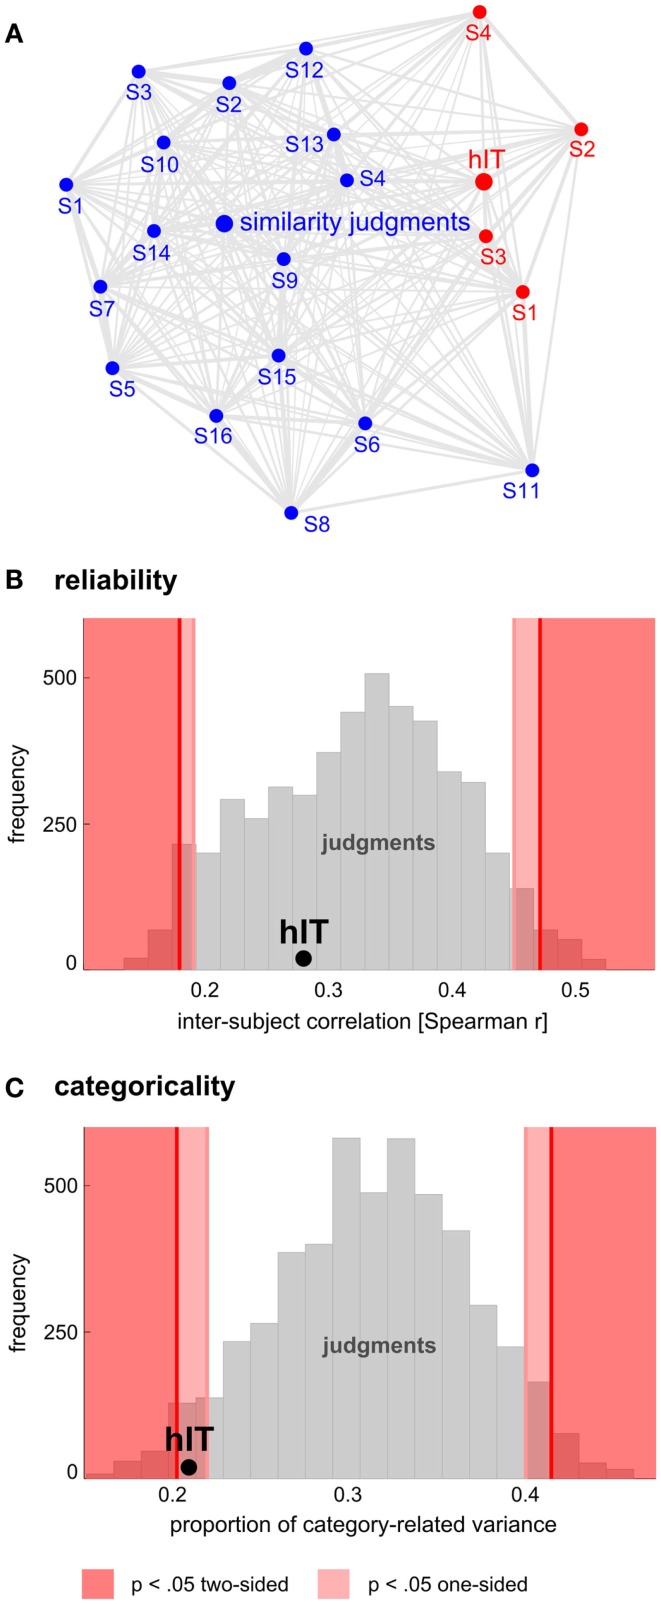
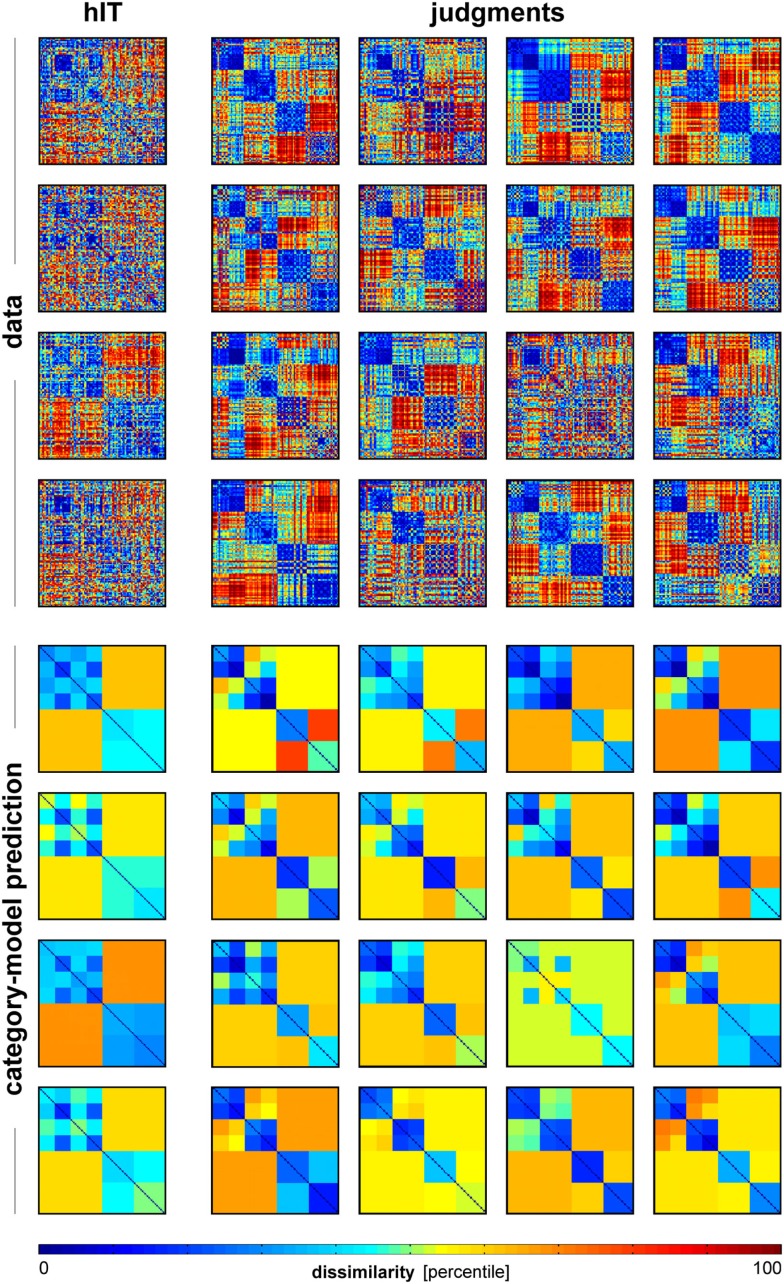
Primate inferior temporal (IT) cortex is thought to contain a high-level representation of objects at the interface between vision and semantics. This suggests that the perceived similarity of real-world objects might be predicted from the IT representation. Here we show that objects that elicit similar activity patterns in human IT (hIT) tend to be judged as similar by humans. The IT representation explained the human judgments better than early visual cortex, other ventral-stream regions, and a range of computational models. Human similarity judgments exhibited category clusters that reflected several categorical divisions that are prevalent in the IT representation of both human and monkey, including the animate/inanimate and the face/body division. Human judgments also reflected the within-category representation of IT. However, the judgments transcended the IT representation in that they introduced additional categorical divisions. In particular, human judgments emphasized human-related additional divisions between human and non-human animals and between man-made and natural objects. hIT was more similar to monkey IT than to human judgments. One interpretation is that IT has evolved visual-feature detectors that distinguish between animates and inanimates and between faces and bodies because these divisions are fundamental to survival and reproduction for all primate species, and that other brain systems serve to more flexibly introduce species-dependent and evolutionarily more recent divisions.

Keywords: fMRI; human; neuronal representation; object perception; primate; representational similarity analysis; vision.


Figures

Figure 1
Figure 1
Stimuli. This figure shows the object images that we presented to our subjects. Two stimuli were described as ambiguous by several of our subjects during debriefing. These stimuli (back of a human head, knitting wool) are marked with a yellow “A.” This figure is adopted from Kriegeskorte et al. (2008b).
Figure 2
Figure 2
Dissimilarity judgments by multi-arrangement (MA). (A) Dissimilarity judgments were acquired using a novel MA method, which allows efficient and subject-tailored acquisition of perceived similarity for large sets of objects. Subjects were asked to arrange the objects according to their similarity, using mouse drag-and-drop on a computer display. Perceived similarity was communicated by adjusting the distances between the objects: objects perceived as similar were placed close together; objects perceived as dissimilar were placed further apart. The upper panel of the figure shows screenshots taken at different moments during the acquisition of the dissimilarity judgments for one subject. Columns correspond to trials and rows show object arrangements over time, running from the start (first row) to the end of each trial (final arrangement, last row). The first trial contained all object images; subsequent trials contained subsets of images that were adaptively selected to optimally estimate perceived similarity for each subject. The black dots represent not-shown arrangements during a trial (small dots) and not-shown trials (large dots). (B) Once acquisition of the dissimilarity judgments was completed, inter-object distances of the final trial arrangements were combined over trials by rescaling and averaging to yield a single dissimilarity estimate for each object pair. Conceptually, this step can be seen as “inverse” multidimensional scaling, since it combines several lower-dimensional (2D) similarity representations into one higher-dimensional similarity representation. This process is shown for two example objects pairs: a boy’s face and a hand (red), and carrots and a stop sign (blue). Their single-trial dissimilarity estimates (arrows) are combined into a single dissimilarity estimate, which is placed at the corresponding entry of the RDM (lower panel). Mirror-symmetric entries are indicated by lighter colors.
Figure 3
Figure 3
Representational dissimilarity matrices (RDMs) and MDS arrangements for human IT and judgments. Human IT activity patterns and human similarity judgments both show an inherently categorical representation of real-world object images with an animate/inanimate top-level division. At the same time, the similarity judgments show additional categorical divisions and stronger clustering than the hIT similarity representation. (A) RDMs based on hIT activity patterns and human similarity judgments. Each RDM is based on data from multiple subjects (4 and 16, respectively), averaged at the level of the dissimilarities. Each entry of a matrix represents hIT activity-pattern dissimilarity (1-r, where r is Pearson correlation coefficient; 316 most visually responsive bilateral hIT voxels defined using independent data) or judged dissimilarity (relative Euclidean distance as measured by the MA method) for a pair of objects. The matrices were independently transformed into percentiles (see color bar). (B) Multidimensional scaling (MDS; criterion: metric stress) was used to visualize the hIT and judgment similarity representations of the 96 real-world object images. Distances between images reflect the dissimilarities that are shown in the RDMs in (A): images that elicited similar activity patterns or that were judged as similar are placed close together; images that elicited dissimilar activity patterns or were judged as dissimilar are placed further apart.
Figure 4
Figure 4
Hierarchical clustering for human IT and human judgments. hIT object-activity patterns have been shown to cluster according to natural categories (top panel) (Kriegeskorte et al., 2008b). In order to assess whether human object-similarity judgments show a similar categorical structure, we performed hierarchical cluster analysis on the similarity judgments (bottom panel). Hierarchical cluster analysis starts with single-image “clusters” and successively combines the two clusters closest to each other to form a hierarchy of clusters. The vertical height of each horizontal link reflects the average dissimilarity between the stimuli of two linked subclusters. hIT activity-pattern dissimilarity was measured as 1-r (where r is Pearson correlation coefficient), judged dissimilarity was measured as relative Euclidean distance (using the MA method). Text labels indicate the major clusters. Both hIT activity patterns and human similarity judgments cluster the objects according to natural categories and show a top-level animate/inanimate division. However, the human similarity judgments introduce additional categorical divisions.
Figure 5
Figure 5
Human dissimilarity judgments emphasize additional categorical divisions not present in human IT. (A) We decomposed the dissimilarity matrices for hIT and judgments into two additive components, reflecting the category-related dissimilarity variance and non-category-related dissimilarity variance (i.e., within-category dissimilarities and noise). (B) The decomposition was performed by fitting a linear model with multiple predictor dissimilarity matrices, each reflecting a categorical division (red, magenta, cyan, blue) or an imbalance between average within-category dissimilarities of two categories (e.g., average within-animate dissimilarity < average within-inanimate dissimilarity). We fitted the model to the RDMs for hIT and judgments using ordinary-least-squares and estimated the ratio of category-related dissimilarity variance (captured by the model) and non-category-related dissimilarity variance (residuals). We then equated the proportion of residual variance by adding noise to the RDM with smaller proportion residual variance. The judgments had a smaller proportion of residual variance. The judgments matrix shown in A contains the added noise. Equating the residual variance is necessary for valid statistical inference (for details on the noise model and inference, see Materials and Methods). (C) We then fitted the model to the residual-equated RDMs and compared hIT and judgments in terms of the percentage of category variance explained by each category division. The animate/inanimate and face/body divisions explained significantly more variance in hIT than in the judgments. The human/non-human and natural/artificial divisions explained significantly more variance in the judgments than in hIT.
Figure 6
Figure 6
Categorical divisions in human IT and monkey IT. We used the linear model from Figure 5 (repeated in (B) for convenience) also to compare the IT representations between human and monkey [same data as in Kriegeskorte et al. (2008b) for both species; a more in-depth analysis of the monkey data is Kiani et al. (2007)]. (A,B) The proportion of residual variance was greater in mIT than hIT. Residual variance was therefore equated by adding noise to the hIT matrix (which is therefore not identical to Figure 5). (C) Descriptively, the animate/inanimate and face/body divisions are prominent in both hIT and mIT and the human/non-human and natural/artificial divisions less so. Monkey IT might emphasize the animate/inanimate division less and the face-body division more relative to human IT. However, we could not perform the randomization test of Figure 5 here, because there were only two monkey subjects. For further inferential analyses comparing hIT, mIT, and human judgments, see Figure 7.
Figure 7
Figure 7
Human IT and monkey IT are more similar to each other than to human judgments. (A) hIT, mIT, and human judgment RDMs compared in a second-order MDS arrangement (criterion: metric stress; distance measure: 1 – Pearson r) before (left) and after (middle) equating the proportion of non-category-related variance by adding dissimilarity noise to the hIT and judgment RDMs. Statistical inference (right, via bootstrapping the stimulus set) indicates that hIT and mIT RDMs are more similar to each other than either of them is to human judgments. (B) The same analysis applied to the predicted RDMs of the category-model (Figure 5) suggests that hIT and mIT are very similar in terms of the categorical divisions they emphasize and significantly more similar to each other in this respect than either of them is to human judgments. (C) The same analysis applied to the residual RDMs of the category-model shows a weak reflection of the category-model results: hIT and mIT appear slightly more similar to each other than either of them is to the human judgments.
Figure 8
Figure 8
hIT activity-pattern dissimilarities and judged dissimilarities are significantly correlated within all images and within category subsets of images. (A) Scatter plot of hIT activity-pattern dissimilarities and judged dissimilarities taken from the subject-average RDMs shown in Figure 3A. A dot is placed for each stimulus pair based on its hIT activity-pattern dissimilarity and judged dissimilarity (three example stimulus pairs are shown). The large gray dots represent all possible stimulus pairs (r = 0.39, p < 0.0001; r is Spearman correlation coefficient). The smaller colored dots placed on top of the gray dots code for subsets of images: green dots represent animate object pairs (r = 0.34, p < 0.0001), cyan dots represent inanimate object pairs (r = 0.19, p < 0.0001), and red dots represent object pairs consisting of an animate and an inanimate object (r = −0.16, p < 0.9975). Consistent with the results in Figure 3, the marginal histograms show that both hIT and judged dissimilarities are larger for object pairs that cross the animate-inanimate category boundary (red) than for object pairs that do not cross this boundary (green and cyan). (B) To test whether the continuous match between hIT and judged dissimilarities would generalize to the population of similarity judgment subjects, we computed the correlation of each single-subject judgment RDM with the subject-average hIT RDM and tested whether the average of those correlations was significantly larger than zero, using a one-sample t test. Bars show the average correlation between hIT and judged dissimilarities across subjects. Error bars show SEM. Asterisks indicate significance (p < 0.001).
Figure 9
Figure 9
hIT activity-pattern dissimilarities and judged dissimilarities are significantly correlated within most finer-grained category subsets of images. (A) Scatter plots of hIT and judged dissimilarities taken from the subject-average RDMs in Figure 3A. A dot is placed for each stimulus pair based on its hIT activity-pattern dissimilarity and judged dissimilarity. The large gray dots represent all possible stimulus pairs, the smaller colored dots placed on top of the gray dots code for subsets of images as indicated in the plot legends. Plot legends show Spearman correlation coefficients and associated p-values computed with a one-sided stimulus-label randomization test (10,000 randomizations). Asterisks indicate significance (*** = p < 0.001, ** = p < 0.01). The hIT and judgment similarity structures are significantly correlated within the following subsets of images: faces, bodies, human bodies, humans, non-human animates, natural objects, and artificial objects. This suggests a shared within-category similarity structure. (B) The within-category match between hIT activity-pattern dissimilarities and judged dissimilarities generalizes to the population of similarity judgment subjects. We computed the correlation of each single-subject similarity judgment RDM with the subject-average hIT RDM and tested whether the average of those correlations was significantly larger than zero, using a one-sample t test. Bars show the average correlation between hIT and judged dissimilarities across subjects. Error bars show SEM. Asterisks indicate significance (p < 0.001).
Figure 10
Figure 10
Similarity judgments’ match to brain and model representations. (A) Multidimensional scaling of similarity representations (criterion: metric stress, distance measure: 1-r, where r is Spearman correlation coefficient). The MDS plot visualizes the relationships between multiple RDMs simultaneously. Text-label colors indicate the type of similarity representation: red indicates brain-activity, blue indicates human similarity judgments, black indicates simple computational models, and gray/blue indicates complex computational models. Single-subject similarity judgment RDMs are shown as well (smaller font). The gray connections between the RDMs reflect the inevitable distortions induced by arranging the higher-dimensional similarity representations in a lower-dimensional space (2D). (B) Match bars for several brain regions and models showing their deviation from the subject-average similarity judgment RDM. The deviation is measured as 1 − Spearman correlation between RDMs. Text color encodes the type of representation as in (A). Error bars indicate the standard error of the deviation estimate. The standard error was estimated as the standard deviation of 100 deviation estimates obtained from bootstrap resamplings of the condition set. The p-value below each bar indicates whether the associated RDM is significantly related to the similarity judgment RDM (stimulus-label randomization test, 10,000 randomizations). hIT is the best match to the similarity judgments.
Figure 11
Figure 11
Human judgments show similar reliability but stronger categoricality than human IT. (A) Multidimensional scaling of single-subject similarity representations (criterion: metric stress, distance measure: 1-r, where r is Spearman correlation coefficient). The MDS plot visualizes the relationships between multiple RDMs simultaneously. Text-label colors indicate the type of similarity representation: red indicates human IT, blue indicates human similarity judgments. Subject-average RDMs are shown in larger font. The gray connections between the RDMs reflect the inevitable distortions induced by arranging the higher-dimensional similarity representations in a lower-dimensional space (2D). Visual inspection of the MDS plot suggests that variability across subjects is similar for judgments and hIT. (B) This panel shows inter-subject reliability for hIT and judgments. We estimated inter-subject reliability as the average pairwise inter-subject RDM correlation (Spearman r), using sets of four subjects (one set for hIT; 5,000 randomly selected subsets for the judgments). The hIT reliability falls well within the judgment distribution, indicating that hIT and judgments do not significantly differ in terms of reliability. (C) This panel shows categoricality for hIT and judgments. We estimated categoricality as the proportion of dissimilarity variance explained by the category-model (Figure 5B), averaged across sets of four subjects (one set for hIT; 5,000 randomly selected subsets for the judgments). Note that we fitted the model after accounting for any difference in reliability between judgments and hIT. The hIT categoricality falls within the bottom 5% of the judgment distribution, which indicates that the judgments are more categorical than the hIT representation.
Figure 12
Figure 12
Single-subject RDMs and category-model predictions for human IT and human judgments. To give an impression of categoricality at the single-subject level, we plotted the single-subject RDMs for hIT and judgments (top panel), and the associated single-subject category-model predictions (bottom panel). The category-model (Figure 5B) was fitted to each subject’s RDM after equating inter-subject reliability between hIT and judgments. Visual inspection suggests stronger categoricality for the judgments than for hIT.
Figure 13
Figure 13
Human similarity judgments show substantial consistency across subjects, for all images and for most category subsets of images. The upper triangle of each matrix shows all possible pairwise inter-subject RDM correlations (Spearman r). The mirror-symmetric entries in the lower triangle of each matrix show the corresponding thresholded p-values. p-values were computed using a stimulus-label randomization test with 10,000 randomizations and corrected for multiple comparisons using the False Discovery Rate. The average of all pairwise 120 inter-subject correlations is shown below each matrix.

References

    1. Capitani E., Laiacona M., Mahon B., Caramazza A. (2003). What are the facts of semantic category-specific deficits? A critical review of the clinical evidence. Cogn. Neuropsychol. 20, 213–26110.1080/02643290244000266 - DOI - PubMed
    1. Carnap R. (1928/1967). The Logical Structure of the World. Berkeley: University of California Press
    1. Chao L. L., Haxby J. V., Martin A. (1999). Attribute-based neural substrates in temporal cortex for perceiving and knowing about objects. Nat. Neurosci. 2, 913–91910.1038/13217 - DOI - PubMed
    1. Connolly A. C., Guntupalli J. S., Gors J., Hanke M., Halchenko Y. O., Wu Y.-C., et al. (2012). The representation of biological classes in the human brain. J. Neurosci. 32, 2608–261810.1523/JNEUROSCI.5547-11.2012 - DOI - PMC - PubMed
    1. Cooke T., Jakel F., Wallraven C., Bulthoff H. H. (2007). Multimodal similarity and categorization of novel, three-dimensional objects. Neuropsychologia 45, 484–49510.1016/j.neuropsychologia.2006.02.009 - DOI - PubMed

LinkOut - more resources