. 2013 May;19(5):627-38.
doi: 10.1261/rna.038422.113. Epub 2013 Mar 22.

Quaking and PTB control overlapping splicing regulatory networks during muscle cell differentiation

Affiliations

Quaking and PTB control overlapping splicing regulatory networks during muscle cell differentiation

Megan P Hall et al. RNA. 2013 May.

Abstract

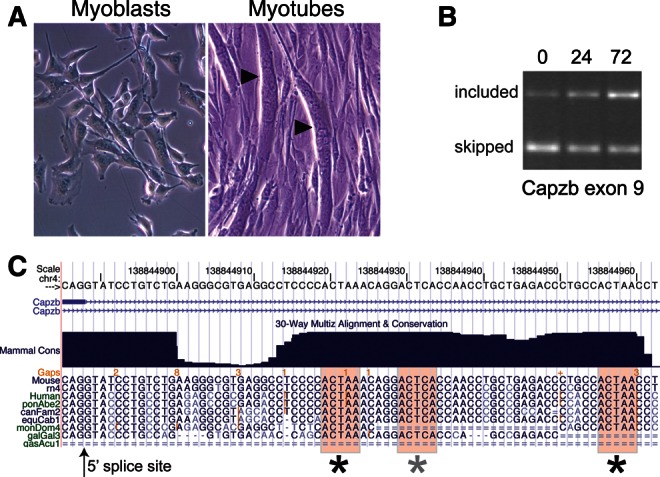
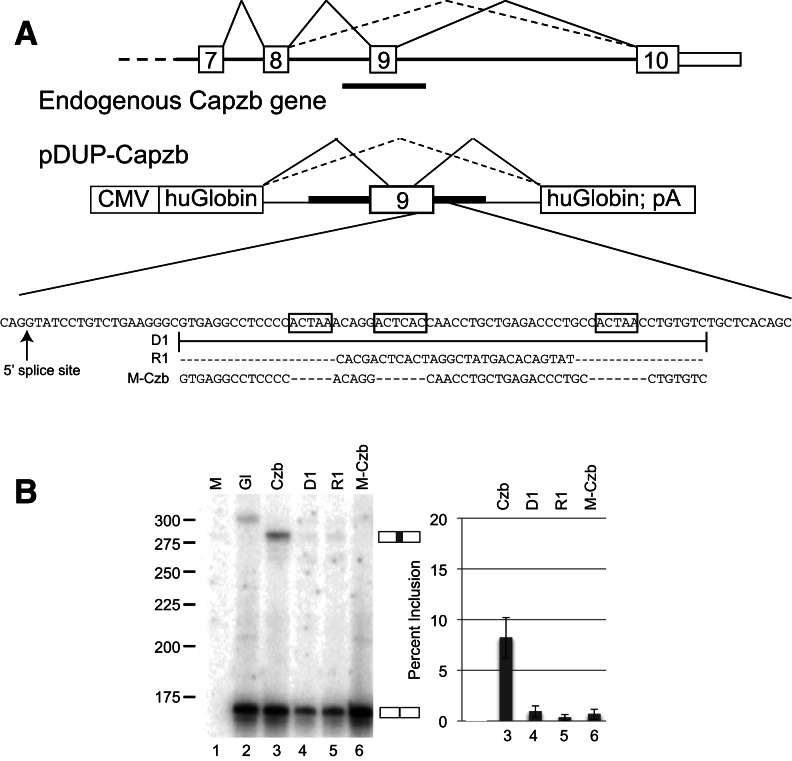
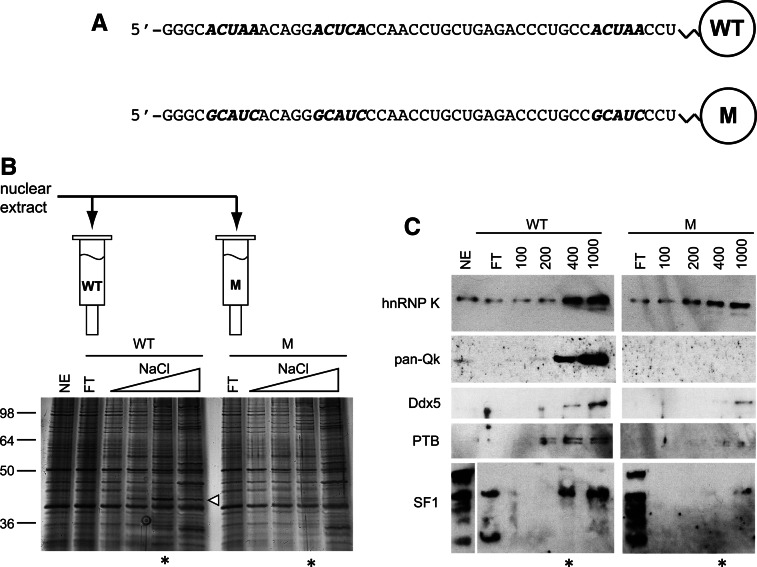
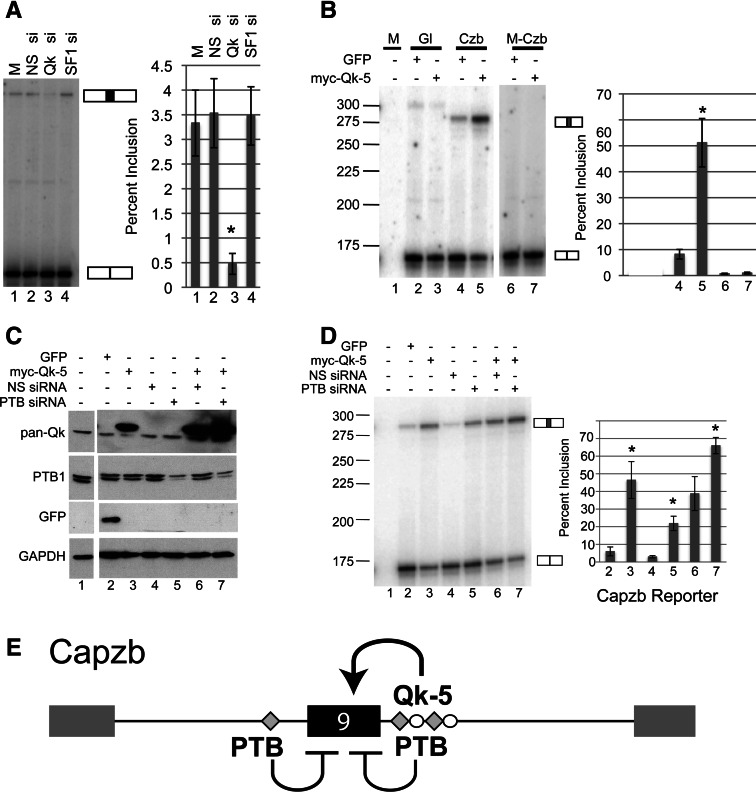
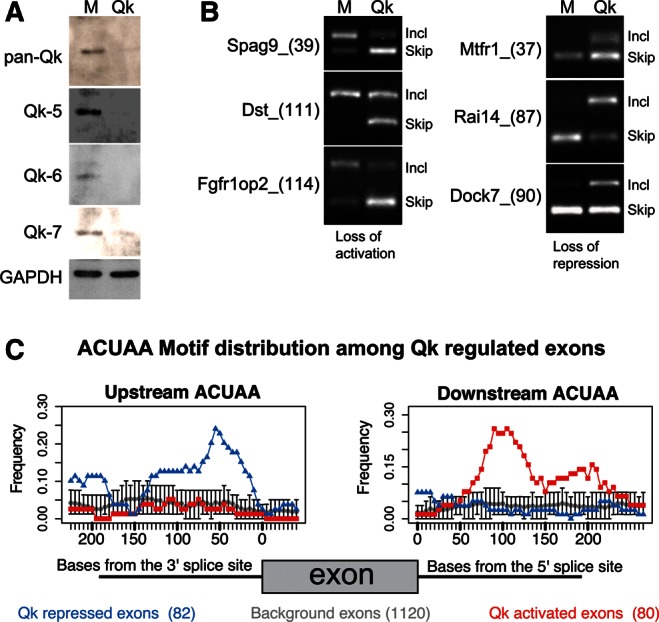
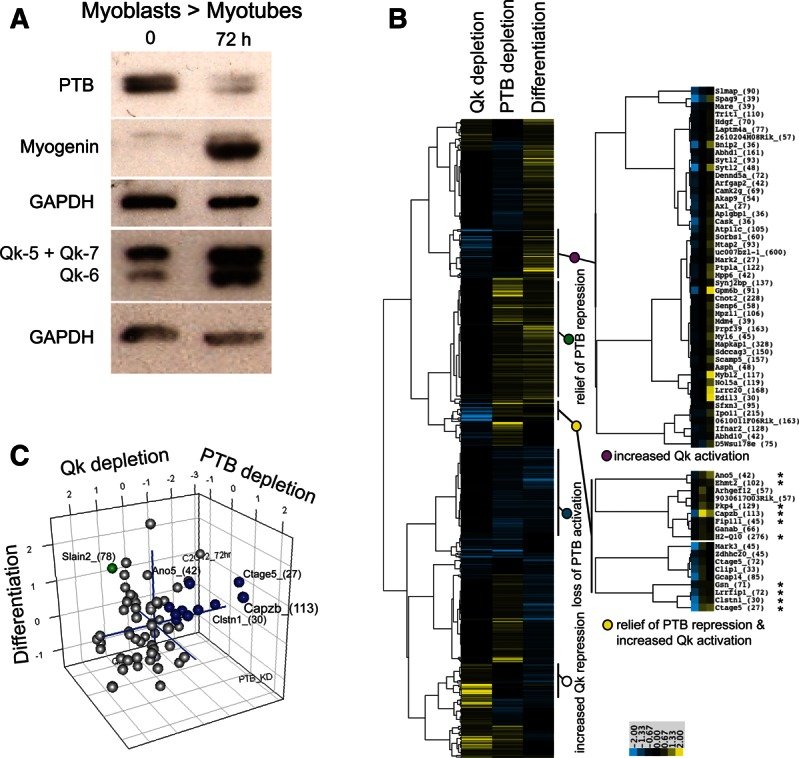
Alternative splicing contributes to muscle development, but a complete set of muscle-splicing factors and their combinatorial interactions are unknown. Previous work identified ACUAA ("STAR" motif) as an enriched intron sequence near muscle-specific alternative exons such as Capzb exon 9. Mass spectrometry of myoblast proteins selected by the Capzb exon 9 intron via RNA affinity chromatography identifies Quaking (QK), a protein known to regulate mRNA function through ACUAA motifs in 3' UTRs. We find that QK promotes inclusion of Capzb exon 9 in opposition to repression by polypyrimidine tract-binding protein (PTB). QK depletion alters inclusion of 406 cassette exons whose adjacent intron sequences are also enriched in ACUAA motifs. During differentiation of myoblasts to myotubes, QK levels increase two- to threefold, suggesting a mechanism for QK-responsive exon regulation. Combined analysis of the PTB- and QK-splicing regulatory networks during myogenesis suggests that 39% of regulated exons are under the control of one or both of these splicing factors. This work provides the first evidence that QK is a global regulator of splicing during muscle development in vertebrates and shows how overlapping splicing regulatory networks contribute to gene expression programs during differentiation.


Figures

FIGURE 1.
FIGURE 1.
Capzb exon 9 is activated during myogenesis and has intronic ACUAA elements. (A) Phase contrast photographs of proliferating C2C12 or cells treated with low serum for 72 h to induce myogenesis. Multinucleate myotubes are indicated by arrowheads. (B) RT-PCR measurement of changes in Capzb exon 9 inclusion during differentiation using primers in exons 8 and 10 of the endogenous Capzb gene. Exon 9 inclusion increases during differentiation. (C) Alignment of intronic sequences downstream from the 5′ splice site bordering Capzb exon 9 from several vertebrates. The ACUAA elements are shaded and marked with asterisks.
FIGURE 2.
FIGURE 2.
Splicing reporters based on Capzb exon 9. (A) Cartoon of Capzb gene structure from exons 7 through 10. The region marked by the black bar below the endogenous gene was amplified by PCR and cloned into pDUP51 to create the reporter construct shown. The sequence below the reporter diagram represents the downstream intronic region containing the ACUAA elements (boxed). Mutations tested are (D1) deletion of the conserved region; (R1) replacement of the conserved region with a nonspecific sequence; (M-Czb) deletion of the ACUAA elements. (B) RNA isolated from proliferating C2C12 cells transiently transfected with the constructs in A were analyzed by RT-PCR using primers specific for the flanking β-globin exons; spliced products are indicated to the right of the gel. Exon percent inclusion for each lane is graphed, far right. Mock-transfected and globin-only controls are shown (M, Gl, lanes 1,2); the band in the Gl lane is nonspecific.
FIGURE 3.
FIGURE 3.
Identification of ACUAA-binding proteins in proliferating C2C12 cells. (A) Sequences of in vitro-transcribed RNAs used. ACUAA motifs or mutant versions are italicized. (B) Silver-stained denaturing gel of proteins bound to the wild-type (WT) or mutant (M) RNAs. Lanes are as follows: NE, nuclear extract; FT, flow through; triangles indicate increasing NaCl elution (0.1, 0.2, 0.4, and 1 M). Arrow points to enriched proteins visible in the WT- but not the M-RNA-binding fractions. Asterisks mark fractions subjected to MudPIT analysis. (C) Western blot of hnRNP K, QK, Ddx5, SF1, and PTB in the eluted fractions. Lanes correlate with those in B.
FIGURE 4.
FIGURE 4.
QK and PTB control inclusion of Capzb exon 9. (A) Analysis of RT-PCR products from C2C12 cells mock-transfected (M) or transiently transfected with a nonspecific siRNA (NS si), a QK-specific siRNA (QK si), or an SF1-specific siRNA (SF1 si). Spliced products corresponding to exon 9-included or excluded endogenous Capzb mRNAs are indicated to the right of the gel. Percent inclusion was quantified and graphed, far right. (B) Overexpression of QK leads to Capzb exon 9 inclusion provided ACUAA elements are intact. Proliferating C2C12 cells were mock transfected (M) or transiently cotransfected with a QK-5 expression construct (myc-QK-5) or a control GFP expression construct (GFP), along with either the wild-type Capzb reporter (Czb) or the mutant reporter with deletion of the ACUAA elements (M-Czb) from Figure 2. A globin-only control is also shown (Gl, lanes 2,3); the band in the Gl lanes is a nonspecific RT-PCR product. Inclusion of the WT Capzb exon increased with expression of QK by approximately fivefold (cf. lanes 4 and 5, P < 0.001, n = 4). Spliced products are indicated and percent inclusion is graphed, far right. QK depletion significantly reduces exon inclusion (asterisk, P < 0.05, cf. lanes 2 and 3). (C) Western blot of whole-cell extract from cells mock-transfected (lane 1) or transiently cotransfected with the Capzb reporter and either a GFP expression construct (GFP), a QK-5 expression construct (myc-QK-5), a nonspecific siRNA (NS siRNA), or a PTB-specific siRNA (PTB siRNA) as indicated at top. Blots were probed with antibodies to GFP, pan-QK, PTB, and GAPDH as a loading control (as indicated to the left of the blots). (D) Analysis of RT-PCR products from RNA isolated from cells transfected in C. Spliced products are indicated to the right of the gel. Percent inclusion was quantified and graphed, far right. (*) P < 0.002. (E) Model for regulation of Capzb exon 9 by QK and PTB. QK activates inclusion through intronic ACUAA elements downstream, and PTB represses inclusion, possibly through sequences similar to PTB-binding sites upstream and/or through binding downstream, as detected by RNA affinity chromatography (Fig. 3).
FIGURE 5.
FIGURE 5.
The QK-splicing regulatory network in proliferating myoblasts. (A) QK siRNA depletes all three forms of QK in myoblasts. Western blot of proteins from proliferating C2C12 cells mock-transfected (M) or transfected with a QK-specific siRNA (QK). Blots were probed with antibodies to pan-QK, QK-5, QK-6, QK-7, and GAPDH as a loading control. (B) RT-PCR validation of splicing changes detected by array analysis. Agarose gel analysis of RT-PCR products for alternative cassette exons using RNA from mock-transfected or QK-depleted cells. Exon-included product is always the upper band, exon-skipped product always the lower. The splicing event is labeled by gene name and exon number and size (nucleotides, in parenthesis). (C) The frequency of ACUAA elements upstream of (left) and downstream from (right) the top 162 QK-regulated cassette exons is mapped. Exons up-regulated by QK depletion are in blue and inferred to be repressed by QK; down-regulated exons are in red and inferred to be activated by QK. Control exons are in gray. Error bars indicate the 95% confidence limit for ACUAA frequency in the control exons.
FIGURE 6.
FIGURE 6.
Regulation of QK protein level, PTB protein level, and alternative splicing during myogenic differentiation. (A) Western blot of proteins during differentiation. Proteins from undifferentiated C2C12 Myoblasts (0) or cells after 72 h of differentiation (Myotubes, 72 h) were detected using antibodies against proteins listed at left: PTB, myogenin, pan-QK (co-migration of QK-5 and QK-7 results in one band, QK-6 is the lower band), and GAPDH. (B) Clustering of splicing events based on their response to QK or PTB depletion in myoblasts relative to their change in splicing during differentiation. Yellow means that inclusion increased, whereas blue indicates reduction in exon inclusion. Asterisks mark exons colored blue in C. A total of 612 cassette exon events with significant changes (q-value ≤ 0.05 and |Sepscore| ≥ 0.3) in at least two data sets are shown; Sepscores that did not meet the significance criteria were replaced with zeros for clustering (Supplemental Table 7). (C) Graph of exons with splicing changes in all three data sets. The Sepscores of 66 exons with q-value ≤ 0.01 and |Sepscore| ≥ 0.3 in all three data sets were plotted using R. Exons activated by QK and repressed by PTB in myoblasts that are activated during differentiation are blue. The Slain2_(78) exon is green.

References

    1. Arning S, Gruter P, Bilbe G, Kramer A 1996. Mammalian splicing factor SF1 is encoded by variant cDNAs and binds to RNA. RNA 2: 794–810 - PMC - PubMed
    1. Baehrecke EH 1997. who encodes a KH RNA binding protein that functions in muscle development. Development 124: 1323–1332 - PubMed
    1. Beuck C, Qu S, Fagg WS, Ares M Jr, Williamson JR 2012. Structural analysis of the Quaking homodimerization interface. J Mol Biol 423: 766–781 - PMC - PubMed
    1. Black DL 2003. Mechanisms of alternative pre-messenger RNA splicing. Annu Rev Biochem 72: 291–336 - PubMed
    1. Bland CS, Wang ET, Vu A, David MP, Castle JC, Johnson JM, Burge CB, Cooper TA 2010. Global regulation of alternative splicing during myogenic differentiation. Nucleic Acids Res 38: 7651–7664 - PMC - PubMed

Publication types

MeSH terms

Substances