. 2013 May;19(5):712-22.
doi: 10.1261/rna.036863.112. Epub 2013 Mar 22.

Identification of extracellular miRNA in human cerebrospinal fluid by next-generation sequencing

Affiliations

Identification of extracellular miRNA in human cerebrospinal fluid by next-generation sequencing

Kasandra Lovette Burgos et al. RNA. 2013 May.

Abstract

There has been a growing interest in using next-generation sequencing (NGS) to profile extracellular small RNAs from the blood and cerebrospinal fluid (CSF) of patients with neurological diseases, CNS tumors, or traumatic brain injury for biomarker discovery. Small sample volumes and samples with low RNA abundance create challenges for downstream small RNA sequencing assays. Plasma, serum, and CSF contain low amounts of total RNA, of which small RNAs make up a fraction. The purpose of this study was to maximize RNA isolation from RNA-limited samples and apply these methods to profile the miRNA in human CSF by small RNA deep sequencing. We systematically tested RNA isolation efficiency using ten commercially available kits and compared their performance on human plasma samples. We used RiboGreen to quantify total RNA yield and custom TaqMan assays to determine the efficiency of small RNA isolation for each of the kits. We significantly increased the recovery of small RNA by repeating the aqueous extraction during the phenol-chloroform purification in the top performing kits. We subsequently used the methods with the highest small RNA yield to purify RNA from CSF and serum samples from the same individual. We then prepared small RNA sequencing libraries using Illumina's TruSeq sample preparation kit and sequenced the samples on the HiSeq 2000. Not surprisingly, we found that the miRNA expression profile of CSF is substantially different from that of serum. To our knowledge, this is the first time that the small RNA fraction from CSF has been profiled using next-generation sequencing.


Figures

FIGURE 1.
FIGURE 1.
Work flow. In order to make a uniform pool of samples for use in all of the RNA isolation kit comparisons, we thawed 20 samples of ∼1 mL each on ice and mixed the samples to create a single pool. The pool was divided into 200-μL aliquots, flash-frozen, and stored at −80°C until they were used.
FIGURE 2.
FIGURE 2.
Average recovery of total RNA from kits using manufacturer-provided protocols. Total RNA yield was assessed by RiboGreen Quant-it assay (ng) from 200 μL of plasma. Isolations were performed in triplicate and the average displayed. There is variability from isolation to isolation as depicted by the error bars (standard error of the mean). For the MRC and RNazol kits, different temperature or centrifugations were tested according to the manufacturer’s recommendations.
FIGURE 3.
FIGURE 3.
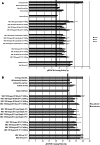
miRNA recovery of C. elegans spike-ins and two endogenous human miRNAs after each isolation kit using Taq qRT-PCR. miRNA yield was measured by TaqMan qRT-PCR. Crossing points (Cp) were compared across (A) three different synthetic C. elegans miRNA cel-238, cel-54, and cel-39 (spike-ins) and (B) two endogenous human miRNA hsa-222 and hsa-26A. The lowest Cp values indicate the highest amount of miRNA recovered and the best kit performance. The black line drawn across the figure represents the lowest Cp values and the highest recovery.
FIGURE 4.
FIGURE 4.
Work flow for first and second extractions. (A) The RNA and denaturing solution are mixed with phenol-chloroform and centrifuged. (B) The aqueous phase is removed and placed in a fresh tube. (C) RNase-free water equal to the volume of the aqueous phase that was removed is added back to the residual interphase and organic layers. (D) Solution is mixed and centrifuged. (E) The aqueous layer is removed and placed into a clean tube as Extraction 2.
FIGURE 5.
FIGURE 5.
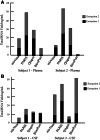
Repeated extraction of the organic phase results in higher RNA yield. (A) Fresh-frozen plasma from two subjects (subject 1 and subject 2) was used for RNA isolation using the top four kits: mirVana and mirVana PARIS (Ambion), miRNeasy (Qiagen), and BiooPure (BiooScientific). Total RNA was recovered and quantified from repeated extractions (black = Extraction 1 and gray = Extraction 2). PARIS kit yielded the highest amount of RNA from both subjects. The yield was more than doubled by the second extraction. (B) Fresh-frozen CSF samples from two subjects were used to compare the efficiency of the top four RNA isolation kits. The RNA recovered in Extraction 1 and Extraction 2 is displayed.
FIGURE 6.
FIGURE 6.
miRNA yields calculated from plasma and CSF with repeated extractions using qRT-PCR. (A) miRNA recovered in Extraction 1 was measured by TaqMan qRT-PCR in fresh-frozen plasma samples from two subjects (subject 1 and subject 2). Crossing point values (Cp) were compared across three different synthetic C. elegans miRNA cel-238, cel-54, and cel-39 (spike-ins) and two endogenous human miRNA hsa-222 and hsa-26A. The lowest Cp values indicate the highest amount of RNA present and best performance, highlighted by the black line. (B) Extraction 2 recovery of miRNA is displayed for each kit. (C) The Cp values for two different subject CSF samples for Extraction 1. There was only enough RNA remaining after RiboGreen for cel-238. (D) Cp values for cel-238 recovered from two CSF samples in Extraction 2.
FIGURE 7.
FIGURE 7.
Comparison of miRNA profiles from human CSF and plasma. (A) We counted the number of miRNAs that had more than two reads across five subjects and averaged the numbers. On average, serum and CSF from subjects had 532 and 486 miRNAs, respectively. Of these, 353 were present in both biofluids, while 179 and 133 were unique to serum and CSF, respectively. The small RNA expression profiles for CSF and serum across different subjects were highly correlative (Spearman correlation: CSF = 0.87208229 and serum = 0.8497603) but different between CSF and plasma within a subject (median Spearman correlations across five subjects = 0.6047526). (B) Scatter plot of CSF and serum miRNA from five subjects combined.

References

    1. Aldridge S, Hadfield J 2012. Introduction to miRNA profiling technologies and cross-platform comparison. Methods Mol Biol 822: 19–31 - PubMed
    1. Baraniskin A, Kuhnhenn J, Schlegel U, Chan A, Deckert M, Gold R, Maghnouj A, Zollner H, Reinacher-Schick A, Schmiegel W, et al. 2011. Identification of microRNAs in the cerebrospinal fluid as marker for primary diffuse large B-cell lymphoma of the central nervous system. Blood 117: 3140–3146 - PubMed
    1. Casalini P, Iorio MV 2010. MicroRNAs and future therapeutic applications in cancer. J BUON 14: S17–S22 - PubMed
    1. Chen X, Ba Y, Ma L, Cai X, Yin Y, Wang K, Guo J, Zhang Y, Chen J, Guo X, et al. 2008. Characterization of microRNAs in serum: A novel class of biomarkers for diagnosis of cancer and other diseases. Cell Res 18: 997–1006 - PubMed
    1. Chen L, Yan HX, Yang W, Hu L, Yu LX, Liu Q, Li L, Huang DD, Ding J, Shen F, et al. 2009. The role of microRNA expression pattern in human intrahepatic cholangiocarcinoma. J Hepatol 50: 358–369 - PubMed

Publication types