. 2013 Feb 12;9(2):1294-1303.
doi: 10.1021/ct300962x. Epub 2012 Dec 22.

Protein Structure Refinement through Structure Selection and Averaging from Molecular Dynamics Ensembles

Affiliations

Protein Structure Refinement through Structure Selection and Averaging from Molecular Dynamics Ensembles

Vahid Mirjalili et al. J Chem Theory Comput. .

Abstract

A molecular dynamics (MD) simulation based protocol for structure refinement of template-based model predictions is described. The protocol involves the application of restraints, ensemble averaging of selected subsets, interpolation between initial and refined structures, and assessment of refinement success. It is found that sub-microsecond MD-based sampling when combined with ensemble averaging can produce moderate but consistent refinement for most systems in the CASP targets considered here.

Keywords: force field; model selection; molecular dynamics simulation; scoring; structure prediction.


Figures

Figure 1
Figure 1
Change in RMSD with respect to native structure (A) and in GDT-HA (B) upon averaging different subsets of structures sorted by either DFIRE scores or iRMSD. Results from the 200 ns MD runs are shown in blue (circles) and from 8×3 ns sampling in green (triangles). Open symbols denote iRMSD-based selection; closed symbols refer to DFIRE-based selection.
Figure 2
Figure 2
Subset selection based on combination of DFIRE and iRMSD scores (normalized by their respective standard deviations). Selected structures (green triangles) are outside the circle with radius (ρ) and within the segment with angle (θ).
Figure 3
Figure 3
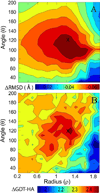
Change in RMSD with respect to native structure (A) and GDT-HA (B) as a function of radius (ρ), and angle (θ). Parameters considered to be optimal and used subsequently for subset averaging are indicated by ‘X’.
Figure 4
Figure 4
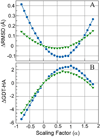
Change in RMSD with respect to native structure (A) and GDT-HA (B) upon structure interpolation between the initial (α=0.0) and the subset-averaged structures (at α=1.0). Results from 200 ns MD runs are shown in blue (circles) and from 8×3 ns sampling in green (triangles).
Figure 5
Figure 5
Change in RMSD with respect to native structure as a function of correlation between iRMSD and DFIRE scores with (green triangles) and without (red squares) structure interpolation.

Similar articles

Cited by

References

    1. Roy A, Kucukural A, Zhang Y. Nat. Protoc. 2010;5:725–738. - PMC - PubMed
    1. Bradley P, Misura KMS, Baker D. Science. 2005;309:1868–1871. - PubMed
    1. Šali A, Blundell TL. J. Mol. Biol. 1993;234:779–815. - PubMed
    1. Lance BK, Deane CM, Wood GR. Bioinformatics. 2010;26:1849–1856. - PubMed
    1. Joo K, Lee J, Lee S, Seo J-H, Lee SJ, Lee J. Proteins: Struct., Funct., Bioinf. 2007;69:83–89. - PubMed

LinkOut - more resources