. 2013 Mar 22:7:27.
doi: 10.3389/fncel.2013.00027. eCollection 2013.

Small is fast: astrocytic glucose and lactate metabolism at cellular resolution

Affiliations

Small is fast: astrocytic glucose and lactate metabolism at cellular resolution

L F Barros et al. Front Cell Neurosci. .

Abstract

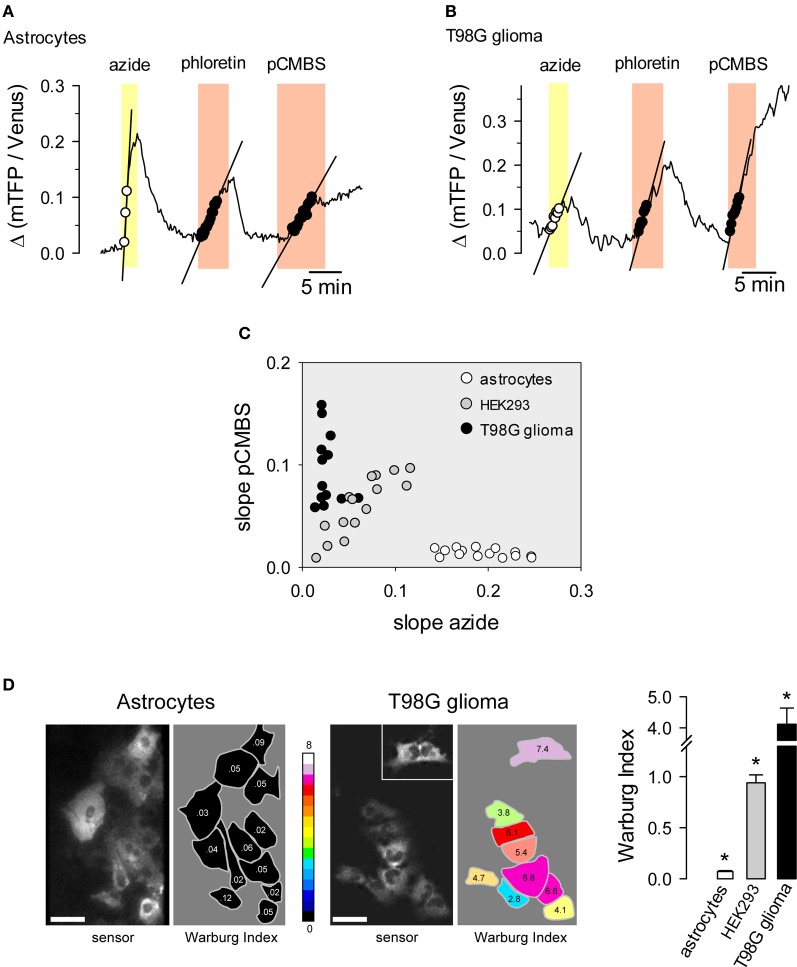
Brain tissue is highly dynamic in terms of electrical activity and energy demand. Relevant energy metabolites have turnover times ranging from milliseconds to seconds and are rapidly exchanged between cells and within cells. Until recently these fast metabolic events were inaccessible, because standard isotopic techniques require use of populations of cells and/or involve integration times of tens of minutes. Thanks to fluorescent probes and recently available genetically-encoded optical nanosensors, this Technology Report shows how it is now possible to monitor the concentration of metabolites in real-time and in single cells. In combination with ad hoc inhibitor-stop protocols, these probes have revealed a key role for K(+) in the acute stimulation of astrocytic glycolysis by synaptic activity. They have also permitted detection of the Warburg effect in single cancer cells. Genetically-encoded nanosensors currently exist for glucose, lactate, NADH and ATP, and it is envisaged that other metabolite nanosensors will soon be available. These optical tools together with improved expression systems and in vivo imaging, herald an exciting era of single-cell metabolic analysis.

Keywords: FLII12Pglu-700δμ6; FRET; cancer metabolism; flux; glycolysis; laconic; mitochondria.


Figures

Figure 1
Figure 1
Stoichiometry of glucose oxidation. The schematic represents the oxidation of glucose to CO2, where the width of the arrows is proportional to flux. Cytosolic NADH is assumed to transfer its electrons to mitochondria through both the malate-aspartate shuttle (rendering 3 ATPs per NADH) and the glycerol phosphate shuttle (rendering 2 ATPs per NADH).
Figure 2
Figure 2
Simulation of the response of metabolites to an instant rise in consumption. The dynamics of each metabolite were simulated independently using the concentration and steady-state flux in Table 1 and the differential equation: d metabolite/dt = production–metabolite × C, where C is the rate constant of consumption. At time zero, C was increased by 100% while production was kept constant, resulting in a 50% decrease in the size of the pool. The speed at which the new steady-state is reached varies dramatically between different metabolites. The inset shows the same data over an extended timescale. The differential equation was solved by numerical simulation using Madonna software.
Figure 3
Figure 3
Expression of the glucose and lactate sensors in astrocytes and HEK293 cells. (A,B) The FRET glucose nanosensor FLII12Pglu700μδ6 and the FRET lactate nanosensor Laconic were expressed in astrocytes using a custom-made adenoviral vector (Vector Biolabs). Confocal images correspond to green emission at 535 nm (Venus) as excited with a 488 nm argon laser. Bar represents 20 μm. (C) HEK293 cells were co-transfected with FLII12Pglu700μδ6 and nuclear-targeted Laconic. The confocal images show the CFP and mTFP emissions at 480 nm (blue channel) and the Citrine and Venus emissions at 535 nm (green channel) of a cell expressing only Laconic (top) and a cell expressing both sensors (bottom). Scale bar is 20 μm.
Figure 4
Figure 4
Estimation of metabolic fluxes with transport-stop protocols.(A) Whereas most mammalian cells are glucose importers, some cells export lactate and some import lactate. (B) A single astrocyte incubated in 2 mM extracellular glucose maintained an intracellular glucose of approx. 0.6 mM. Interruption of the steady state by blocking the glucose transporter GLUT1 with 20 μM cytochalasin B caused a decrease in the cytosolic concentration of glucose at a rate of −7.2 μM/s. (C) A HEK293 was incubated in 25 mM glucose. Blockage of the MCT with 50 μM phloretin caused an accumulation of intracellular lactate with an initial rate of 2.3 μM/s. (D) Same cell as in (B) but incubated in 1 mM lactate in the absence of glucose. Blockage of the MCT with 50 μ M phloretin caused a depletion of intracellular lactate with an initial rate of −0.5 μM/s.
Figure 5
Figure 5
Use of the lactate sensor to detect the Warburg effect. An astrocyte (A) and a T98G glioma cell (B) expressing Laconic were sequentially exposed to 5 mM sodium azide, 50 μM phloretin and 500 μM pCMBS. The straight lines represent initial slopes of lactate accumulation fitted by linear regression within the same range of ratio values. (C) Correlation plot between the rates of lactate accumulation (Δ ratio/min) in sodium azide and in pCMBS. Symbols represent single astrocytes (white), HEK293 cells (gray) or T98G cells (black). (D) The Warburg Index was estimated as the ratio between the rates of lactate production with pCMBS and lactate accumulation with azide, and was used to color the silhouette of each cell according to the 16-color look up table. The inset shows an isolated cell that was located about 100 μm from the cluster. The bar graph summarizes data from 3 experiments in each cell type. Scale bars are 20 μm. *p < 0.05 between every cell type. Modified from San Martín et al. (2013).

Similar articles

Cited by

References

    1. Allaman I., Belanger M., Magistretti P. J. (2011). Astrocyte-neuron metabolic relationships: for better and for worse. Trends Neurosci. 34, 76–87 10.1016/j.tins.2010.12.001 - DOI - PubMed
    1. Barros L. F., Deitmer J. W. (2010). Glucose and lactate supply to the synapse. Brain Res. Rev. 63, 149–159 10.1016/j.brainresrev.2009.10.002 - DOI - PubMed
    1. Barros L. F., Martinez C. (2007). An enquiry into metabolite domains. Biophys. J. 92, 3878–3884 10.1529/biophysj.106.100925 - DOI - PMC - PubMed
    1. Barros L. F., Baeza-Lehnert F., Valdebenito R., Ceballo S., Alegría K. (2013). Fluorescent nanosensor based flux analysis: overview and the example of glucose, in Springer Protocols: Brain Energy Metabolism, eds Waagepetersen H. S., Hirrlinger J. (New York, NY: Springer; ), (in press).
    1. Barros L. F., Bittner C. X., Loaiza A., Porras O. H. (2007). A quantitative overview of glucose dynamics in the gliovascular unit. Glia 55, 1222–1237 10.1002/glia.20375 - DOI - PubMed

LinkOut - more resources