

Risk in vaccine research and development quantified
- PMID: 23526951
- PMCID: PMC3603987
- DOI: 10.1371/journal.pone.0057755
Risk in vaccine research and development quantified
Abstract
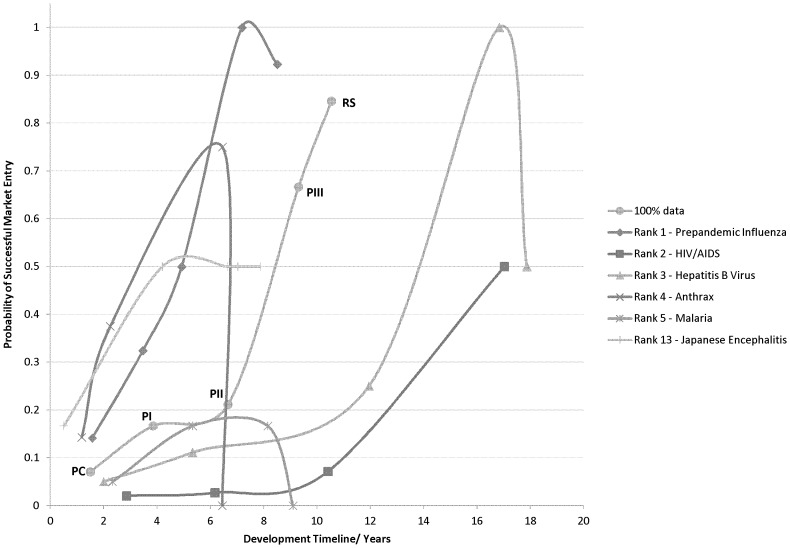
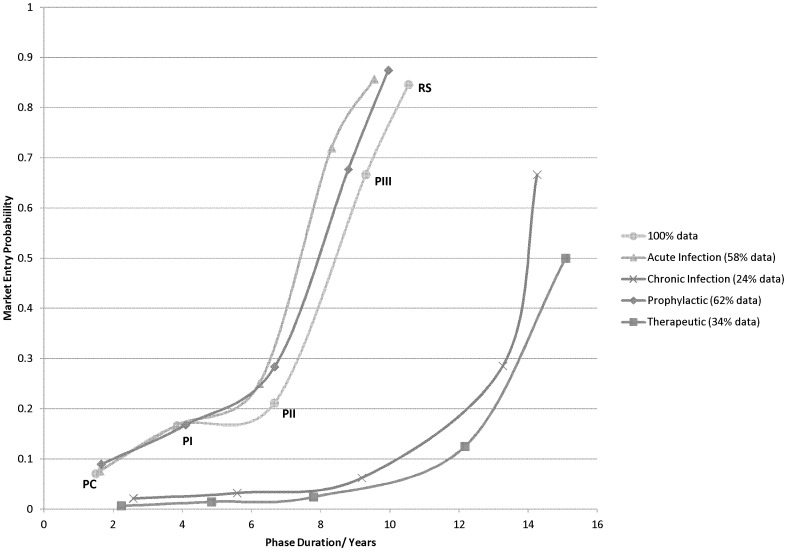
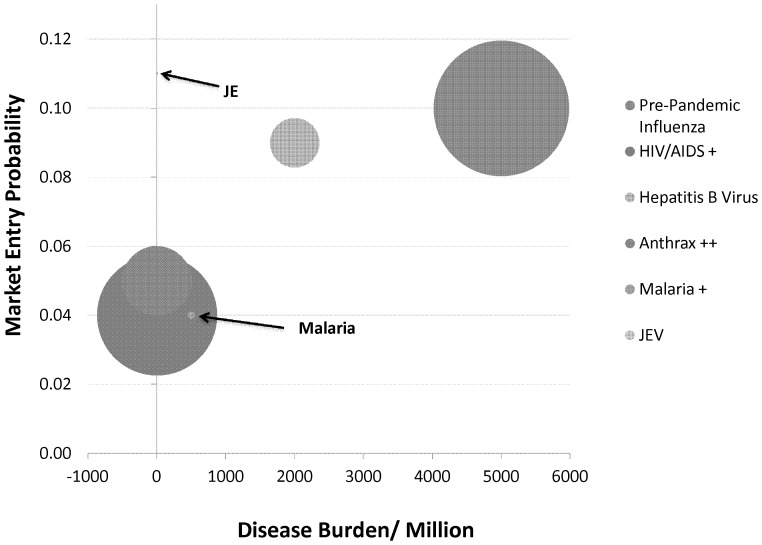
To date, vaccination is the most cost-effective strategy to combat infectious diseases. Recently, a productivity gap affects the pharmaceutical industry. The productivity gap describes the situation whereby the invested resources within an industry do not match the expected product turn-over. While risk profiles (combining research and development timelines and transition rates) have been published for new chemical entities (NCE), little is documented on vaccine development. The objective is to calculate risk profiles for vaccines targeting human infectious diseases. A database was actively compiled to include all vaccine projects in development from 1998 to 2009 in the pre-clinical development phase, clinical trials phase I, II and III up to Market Registration. The average vaccine, taken from the preclinical phase, requires a development timeline of 10.71 years and has a market entry probability of 6%. Stratification by disease area reveals pandemic influenza vaccine targets as lucrative. Furthermore, vaccines targeting acute infectious diseases and prophylactic vaccines have shown to have a lower risk profile when compared to vaccines targeting chronic infections and therapeutic applications. In conclusion; these statistics apply to vaccines targeting human infectious diseases. Vaccines targeting cancer, allergy and autoimmune diseases require further analysis. Additionally, this paper does not address orphan vaccines targeting unmet medical needs, whether projects are in-licensed or self-originated and firm size and experience. Therefore, it remains to be investigated how these - and other - variables influence the vaccine risk profile. Although we find huge differences between the risk profiles for vaccine and NCE; vaccines outperform NCE when it comes to development timelines.
Conflict of interest statement
Figures
References
-
- Andre F (2001) Short Survey: the Future of Vaccines, Immunization Concepts and Practices. Vaccine 19: 2206–2209. - PubMed
-
- Armstrong G, Conn L, Pinner R (1999) Trends in Infectious Disease Mortality in the US During the 20th Century. Journal of American Medical Association 281: 61–66. - PubMed
-
- Davis M, Butchart A, Coleman M, Singer D, Wheeler J, et al. (2010) The Expanding Vaccine Pipeline, 1995–2008. Vaccine 28: 1353–1356. - PubMed
-
- Ulmer B, Valley U, Rappuoli R (2006) Vaccine manufacturing; Challenges and solutions. Nature Biotechnology 24: 1377–1383. - PubMed
-
- Andre F (2002) How the Research-based Industry Approaches Vaccine Development and Establishes Priorities. Developments in Biology 110: 25–29. - PubMed
Publication types
MeSH terms
Substances
LinkOut - more resources
Full Text Sources
Other Literature Sources
Medical
Miscellaneous
