

Geographic divisions and modeling of virological data on seasonal influenza in the Chinese mainland during the 2006-2009 monitoring years
- PMID: 23526984
- PMCID: PMC3602224
- DOI: 10.1371/journal.pone.0058434
Geographic divisions and modeling of virological data on seasonal influenza in the Chinese mainland during the 2006-2009 monitoring years
Abstract
Background: Seasonal influenza epidemics occur annually with bimodality in southern China and unimodality in northern China. Regional differences exist in surveillance data collected by the National Influenza Surveillance Network of the Chinese mainland. Qualitative and quantitative analyses on the spatiotemporal rules of the influenza virus's activities are needed to lay the foundation for the surveillance, prevention and control of seasonal influenza.
Methods: The peak performance analysis and Fourier harmonic extraction methods were used to explore the spatiotemporal characteristics of the seasonal influenza virus activity and to obtain geographic divisions. In the first method, the concept of quality control was introduced and robust estimators were chosen to make the results more convincing. The dominant Fourier harmonics of the provincial time series were extracted in the second method, and the VARiable CLUSter (VARCLUS) procedure was used to variably cluster the extracted results. On the basis of the above geographic division results, three typical districts were selected and corresponding sinusoidal models were applied to fit the time series of the virological data.
Results: The predominant virus during every peak is visible from the bar charts of the virological data. The results of the two methods that were used to obtain the geographic divisions have some consistencies with each other and with the virus activity mechanism. Quantitative models were established for three typical districts: the south1 district, including Guangdong, Guangxi, Jiangxi and Fujian; the south2 district, including Hunan, Hubei, Shanghai, Jiangsu and Zhejiang; and the north district, including the 14 northern provinces except Qinghai. The sinusoidal fitting models showed that the south1 district had strong annual periodicity with strong winter peaks and weak summer peaks. The south2 district had strong semi-annual periodicity with similarly strong summer and winter peaks, and the north district had strong annual periodicity with only winter peaks.
Conflict of interest statement
Figures
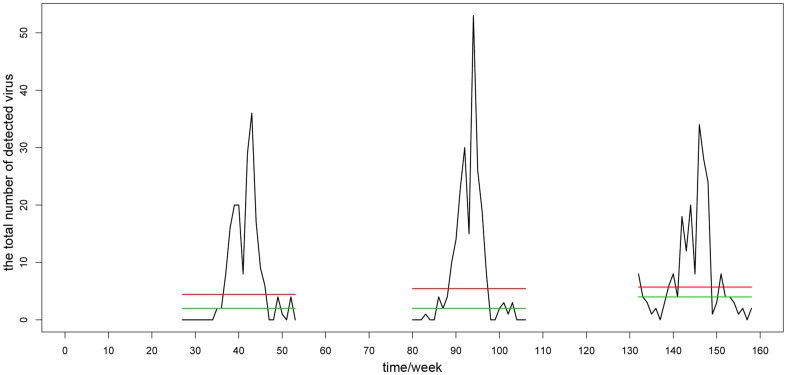
 control limits, that is, the thresholds. More information about the results of this method is given in Table S1, S2 in detail.


References
-
- Reichert TA, Simonsen L, Sharma A, Pardo SA, Fedson DS, et al. (2004) Influenza and the winter increase in mortality in the United States, 1959–1999. Am J Epidemiol 160 (5) 492–502. - PubMed
Publication types
MeSH terms
LinkOut - more resources
Full Text Sources
Other Literature Sources
Medical
