. 2013;8(3):e59443.
doi: 10.1371/journal.pone.0059443. Epub 2013 Mar 20.

Leucine and protein metabolism in obese Zucker rats

Affiliations

Leucine and protein metabolism in obese Zucker rats

Pengxiang She et al. PLoS One. 2013.

Abstract

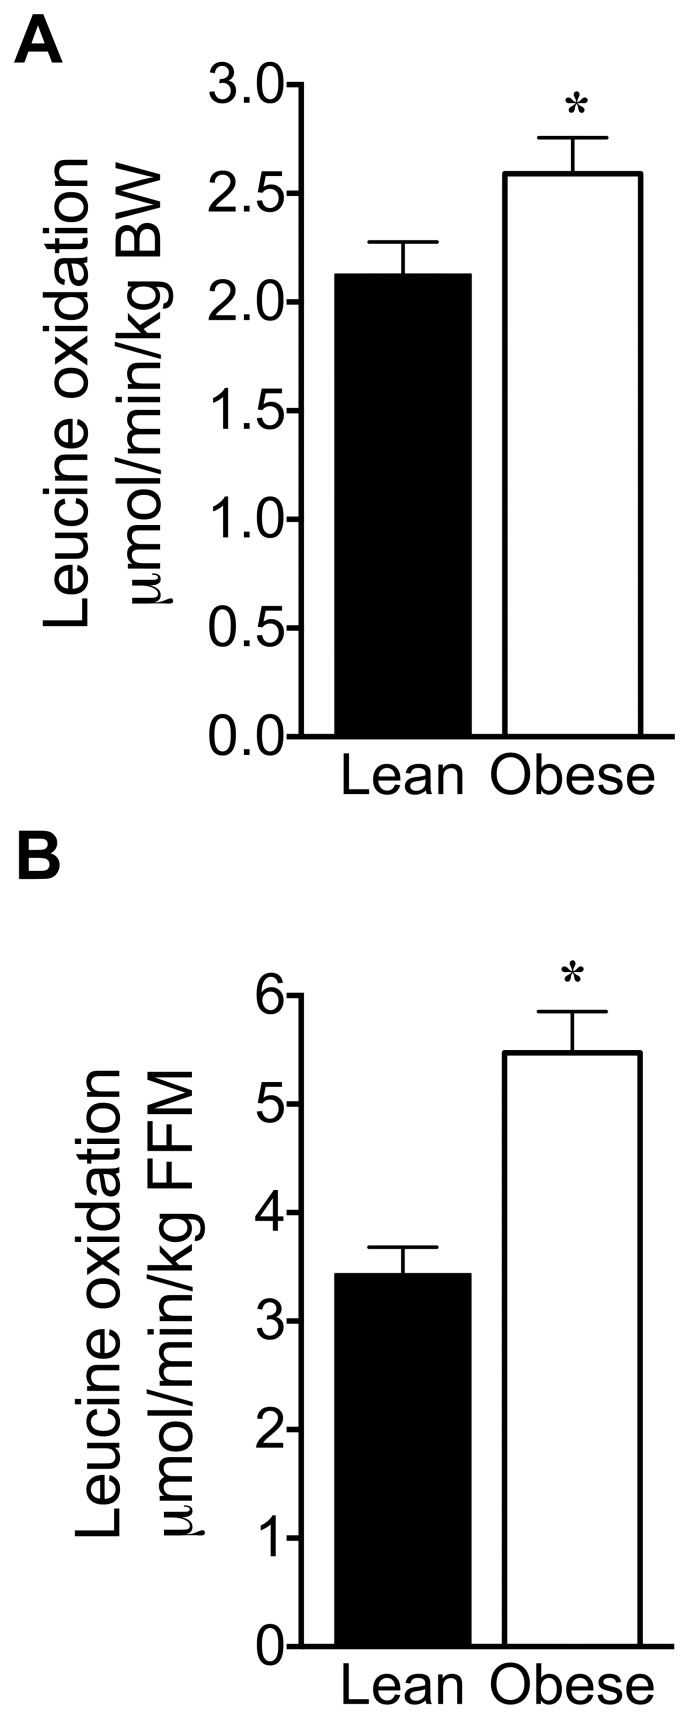
Branched-chain amino acids (BCAAs) are circulating nutrient signals for protein accretion, however, they increase in obesity and elevations appear to be prognostic of diabetes. To understand the mechanisms whereby obesity affects BCAAs and protein metabolism, we employed metabolomics and measured rates of [1-(14)C]-leucine metabolism, tissue-specific protein synthesis and branched-chain keto-acid (BCKA) dehydrogenase complex (BCKDC) activities. Male obese Zucker rats (11-weeks old) had increased body weight (BW, 53%), liver (107%) and fat (∼300%), but lower plantaris and gastrocnemius masses (-21-24%). Plasma BCAAs and BCKAs were elevated 45-69% and ∼100%, respectively, in obese rats. Processes facilitating these rises appeared to include increased dietary intake (23%), leucine (Leu) turnover and proteolysis [35% per g fat free mass (FFM), urinary markers of proteolysis: 3-methylhistidine (183%) and 4-hydroxyproline (766%)] and decreased BCKDC per g kidney, heart, gastrocnemius and liver (-47-66%). A process disposing of circulating BCAAs, protein synthesis, was increased 23-29% by obesity in whole-body (FFM corrected), gastrocnemius and liver. Despite the observed decreases in BCKDC activities per gm tissue, rates of whole-body Leu oxidation in obese rats were 22% and 59% higher normalized to BW and FFM, respectively. Consistently, urinary concentrations of eight BCAA catabolism-derived acylcarnitines were also elevated. The unexpected increase in BCAA oxidation may be due to a substrate effect in liver. Supporting this idea, BCKAs were elevated more in liver (193-418%) than plasma or muscle, and per g losses of hepatic BCKDC activities were completely offset by increased liver mass, in contrast to other tissues. In summary, our results indicate that plasma BCKAs may represent a more sensitive metabolic signature for obesity than BCAAs. Processes supporting elevated BCAA]BCKAs in the obese Zucker rat include increased dietary intake, Leu and protein turnover along with impaired BCKDC activity. Elevated BCAAs/BCKAs may contribute to observed elevations in protein synthesis and BCAA oxidation.


Conflict of interest statement

Competing Interests: Yasuko Kawamata, Hideki Matsumoto and Ryosei Sakai are employed by the Institute for Innovation, Ajinomoto. Co., Inc. The only financial support provided by Ajinomoto was directly related to the costs of their analyses performed at their site. There are no patents, products in development or marketed products to declare. This does not alter the authors' adherence to all the PLOS ONE policies on sharing data and materials, as detailed online in the guide for authors.

Figures

Figure 1
Figure 1. Illustration of experimental set up for measuring Leu flux in rats.
After being filtered through mist (Fuller’s Earth) and CO2 (Soda lime) absorbent, a constant stream of air flowed through one tube to a closed metabolic cage with a quiet convection fan (Columbus Instruments, Columbus, OH) and out through two outlet tubes which bubbled into a 50 ml conical tube containing Hyamine 10X hydroxide (Perkin Elmer, Waltham, MA)-ethanol (1∶1, vol/vol) for CO2 fixation. 14CO2 samples were collected every 10 min throughout the infusions. The rat was implanted with a jugular vein catheter and infused with [14C]-NaHCO3 (Moravek Biochemical, Brea, CA) and then [1-14C]-Leu (Moravek Biochemical, Brea, CA). [14C]-NaHCO3 and [1-14C]-Leu were each sequentially infused for 2 h. Three blood samples were collected at the 90 and 105 min (0.5 ml) and 120 min (∼3 ml) after start of [1-14C]-Leu infusion. A carotid catheter (not shown) came through the same sealed cage port as the jugular cannula pair and was used for blood sampling.
Figure 2
Figure 2. Schematic of whole-body BCAA metabolism.
Ketoacids are formed by reversible transamination catalyzed by the mitochondrial or cytosolic isoforms of branched chain amino acid transaminase (BCAT). The action of the branched chain keto acid dehydrogenase complex (BCKDC) in the mitochondrial matrix leads to the evolution of CO2 from the 1-carbon of the keto acids including KIC, which was 14C labeled and measured from the expired air in these studies. Subsequent intramitochondrial metabolism leads to the formation of various acyl-coenzyme A (R-CoA) esters that can reversibly form acylcarnitines (not displayed). Neither FAD and NAD Cofactors nor CO2 and H2O substrates are displayed. Bold font indicates metabolites or corresponding acylcarnitines that were detected and measured quantitatively in the 24 h urines (Table 4–5). AA, amino acids.
Figure 3
Figure 3. Plasma and tissue BCAA and BCKA concentrations in lean and obese Zucker rats.
Concentrations of BCAAs (Leu, Val and Ile: A, C, E) and BCKAs (KIC, KIV, and KMV: B, D, F) are shown for plasma (A, B), gastrocnemius muscle (C, D) and liver (E,F). Bars are mean ± SE; *P<0.05, n = 9 and 8 determinations for lean and obese rats, respectively.
Figure 4
Figure 4. 24-h urine acylcarnitines derived from BCAA metabolism.
The graphs are organized to align with the pathway in Fig. 2. A solid arrow indicates a single enzymatic step between the metabolism of the corresponding Co-A species from which the acylcarnitines are derived; a broken arrow indicates several steps. Mean ± SE are shown, *** p<0.001, **** p<0.0001.
Figure 5
Figure 5. Plasma 14C KIC and Leu specific activity (SA) and turnover in lean and obese Zucker rats.
Plasma 14C-SA for KIC (A) and Leu (B) were calculated dividing DPM radioactivity of KIC and Leu with their amounts in each sample. Leu turnover (Leu flux or rate of appearance) was calculated by dividing Leu infusion rate with the plasma 14C KIC SA and expressed per kg of body wt (BW) (C) or fat free mass (FFM) (D). Values are mean ± SE; * P<0.05, n = 9 and 8 for lean and obese rats, respectively.
Figure 6
Figure 6. Whole-body proteolysis and muscle proteolysis in lean and obese Zucker rats.
Whole-body proteolysis was expressed either per kg of body weight (BW) (A) or fat free mass (FFM) (B). Values are mean ± SE; * P<0.05, n = 9 and 8 for lean and obese rats, respectively, in A and B. The ratio of urinary muscle derived 3-MeHis to creatinine (C) was calculated from 24-h urinary amounts of 3-MeHis and creatinine to normalize 3-MeHis excretion by creatinine (D). Values are mean ± SE; * P<0.05, n = 10 for both groups in C and D.
Figure 7
Figure 7. Protein synthesis in whole-body and selected tissues of lean and obese Zucker rats.
Whole-body protein synthesis (A,B) was expressed either per kg of body weight (BW, panel A) or fat free mass (FFM, panel B). *P<0.05, n = 9 and 8 for lean and obese rats, respectively. (C) In vivo protein synthesis in indicated tissues was measure using 3H-phenylalanine (3H-Phe) flooding dose method. Values are mean ± SE; *P<0.05, n = 10 for both groups in panel C.
Figure 8
Figure 8. Whole-body leucine oxidation in lean and obese Zucker rats.
Whole-body leucine oxidation was expressed either per kg of body weight (BW) (A) or FFM (B). Leu oxidation was calculated by dividing the rate of 14CO2 production with plasma 14C-KIC SA. Values are mean ± SE; * P<0.05, n = 9 and 8 for lean and obese rats.

References

    1. Cota D, Proulx K, Smith KA, Kozma SC, Thomas G, et al. (2006) Hypothalamic mTOR signaling regulates food intake. Science 312: 927–930. - PubMed
    1. Su Y, Lam TK, He W, Pocai A, Bryan J, et al. (2012) Hypothalamic leucine metabolism regulates liver glucose production. Diabetes 61: 85–93. - PMC - PubMed
    1. Zhou Y, Jetton TL, Goshorn S, Lynch CJ, She P (2010) Transamination Is Required for {alpha}-Ketoisocaproate but not Leucine to Stimulate Insulin Secretion. J Biol Chem. - PMC - PubMed
    1. Lynch CJ, Patson BJ, Anthony J, Vaval A, Jefferson LS, et al. (2002) Leucine is a direct-acting nutrient signal that regulates protein synthesis in adipose tissue. Am J Physiol Endocrinol Metab 283: E503–513. - PubMed
    1. Lynch CJ, Gern B, Lloyd C, Hutson SM, Eicher R, et al. (2006) Leucine in food mediates some of the postprandial rise in plasma leptin concentrations. American journal of physiology Endocrinology and metabolism 291: E621–630. - PubMed

Publication types

MeSH terms

LinkOut - more resources