Unequal trends in coronary heart disease mortality by socioeconomic circumstances, England 1982-2006: an analytical study
- PMID: 23527228
- PMCID: PMC3603902
- DOI: 10.1371/journal.pone.0059608
Unequal trends in coronary heart disease mortality by socioeconomic circumstances, England 1982-2006: an analytical study
Abstract
Background: Coronary heart disease (CHD) remains a major public health burden, causing 80,000 deaths annually in England and Wales, with major inequalities. However, there are no recent analyses of age-specific socioeconomic trends in mortality. We analysed annual trends in inequalities in age-specific CHD mortality rates in small areas in England, grouped into deprivation quintiles.
Methods: We calculated CHD mortality rates for 10-year age groups (from 35 to ≥ 85 years) using three year moving averages between 1982 and 2006. We used Joinpoint regression to identify significant turning points in age- sex- and deprivation-specific time trends. We also analysed trends in absolute and relative inequalities in age-standardised rates between the least and most deprived areas.
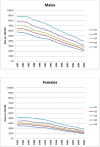
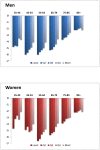
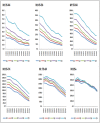
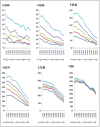
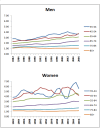
Results: Between 1982 and 2006, CHD mortality fell by 62.2% in men and 59.7% in women. Falls were largest for the most deprived areas with the highest initial level of CHD mortality. However, a social gradient in the pace of fall was apparent, being steepest in the least deprived quintile. Thus, while absolute inequalities narrowed over the period, relative inequalities increased. From 2000, declines in mortality rates slowed or levelled off in the youngest groups, notably in women aged 45-54 in the least deprived groups. In contrast, from age 55 years and older, rates of fall in CHD mortality accelerated in the 2000s, likewise falling fastest in the least deprived quintile.
Conclusions: Age-standardised CHD mortality rates have declined substantially in England, with the steepest falls in the most affluent quintiles. However, this concealed contrasting patterns in underlying age-specific rates. From 2000, mortality rates levelled off in the youngest groups but accelerated in middle aged and older groups. Mortality analyses by small areas could provide potentially valuable insights into possible drivers of inequalities, and thus inform future strategies to reduce CHD mortality across all social groups.
Conflict of interest statement
Figures
References
-
- Siegler V, Langford A, Johnson B (2008) Regional differences in male mortality inequalities using the National Statistics Socio-Economic Classification, England and Wales, 2001–03. Health Stat Q 40: 6–17. - PubMed
-
- Langford A, Johnson B, Al-Hamad A (2009) Social inequalities in female mortality by region and by selected causes of death, England and Wales, 2001–03. Health Stat Q 44: 7–26. - PubMed
-
- Scarborough P, Allender S, Peto V, Rayner M (2008) Regional and social differences in Coronary Heart Disease 2008. London: British Heart Foundation.
-
- The Marmot Review (2010) The social gradient in cardiovascular disease explains more than half of the mortality gap between rich and poor. Fair Society, Healthy Lives: A Strategic Review of Health Inequalities in England Post-2010 (www.marmotreview.org).
-
- O’Flaherty M, Ford E, Allender S, Scarborough P, Capewell S (2008) Coronary heart disease trends in England and Wales from 1984 to 2004: concealed levelling of mortality rates among young adults. Heart 94: 178–181. - PubMed
Publication types
MeSH terms
Grants and funding
LinkOut - more resources
Full Text Sources
Other Literature Sources
Medical

