. 2013;8(3):e59856.
doi: 10.1371/journal.pone.0059856. Epub 2013 Mar 20.

Assessment of subcortical source localization using deep brain activity imaging model with minimum norm operators: a MEG study

Affiliations

Assessment of subcortical source localization using deep brain activity imaging model with minimum norm operators: a MEG study

Yohan Attal et al. PLoS One. 2013.

Abstract

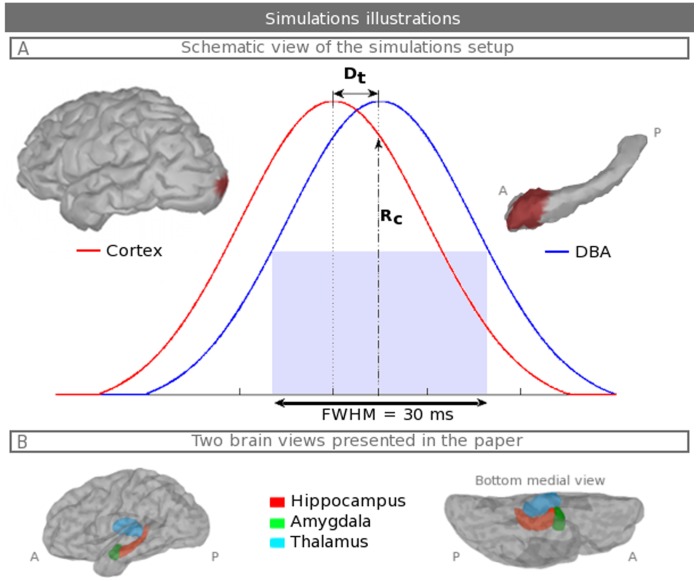
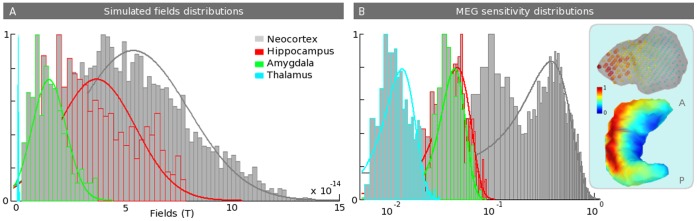
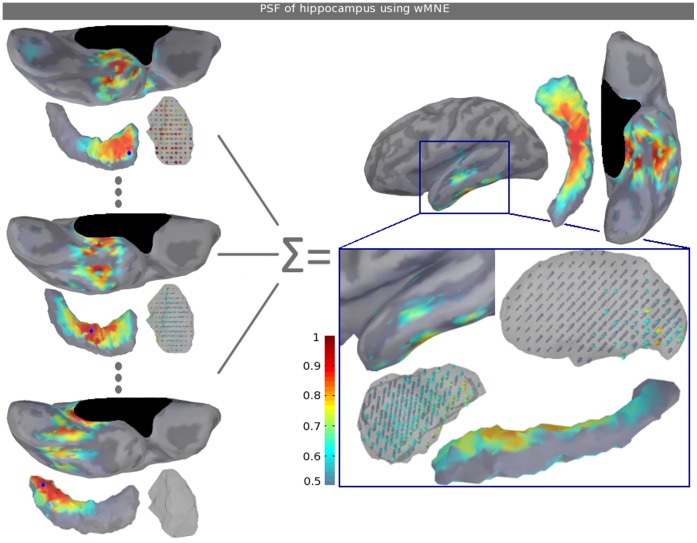
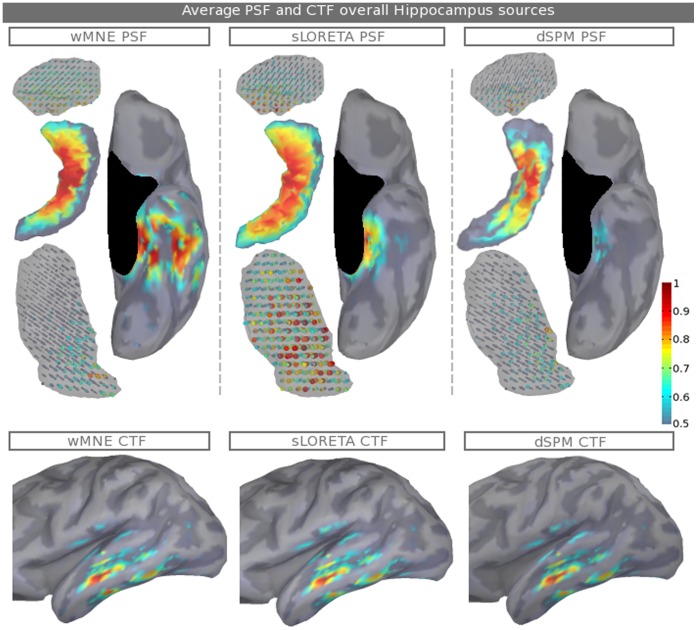
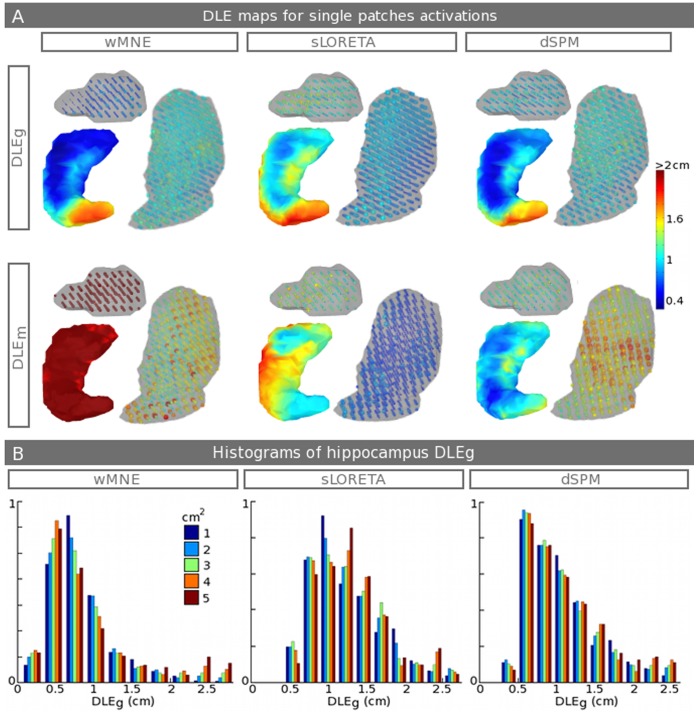
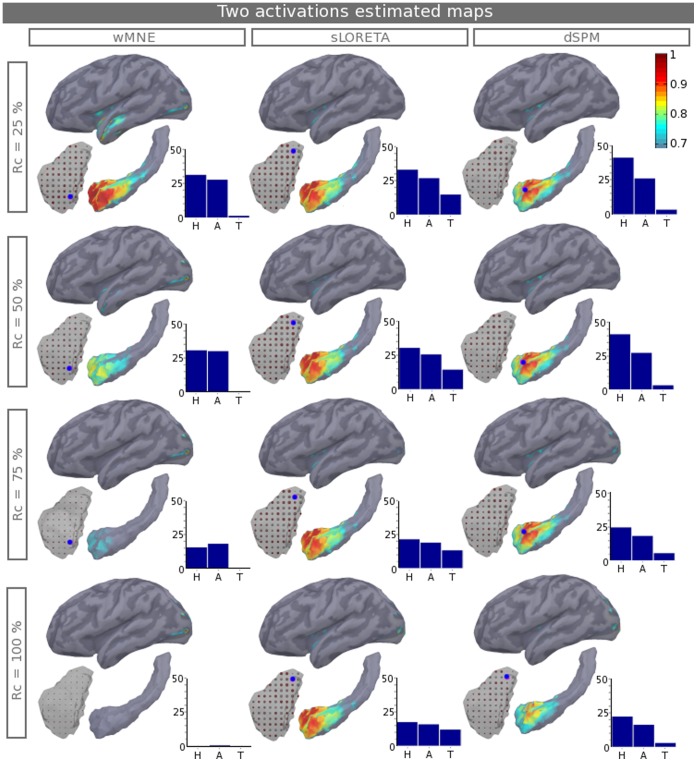
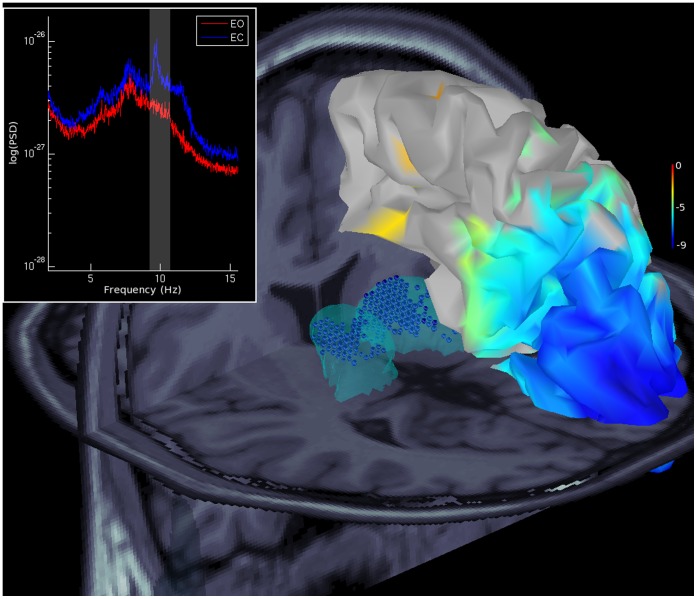
Subcortical structures are involved in many healthy and pathological brain processes. It is crucial for many studies to use magnetoencephalography (MEG) to assess the ability to detect subcortical generators. This study aims to assess the source localization accuracy and to compare the characteristics of three inverse operators in the specific case of subcortical generators. MEG has a low sensitivity to subcortical sources mainly because of their distance from sensors and their complex cyto-architecture. However, we show that using a realistic anatomical and electrophysiological model of deep brain activity (DBA), the sources make measurable contributions to MEG sensors signals. Furthermore, we study the point-spread and cross-talk functions of the wMNE, sLORETA and dSPM inverse operators to characterize distortions in cortical and subcortical regions and to study how noise-normalization methods can improve or bias accuracy. We then run Monte Carlo simulations with neocortical and subcortical activations. In the case of single hippocampus patch activations, the results indicate that MEG can indeed localize the generators in the head and the body of the hippocampus with good accuracy. We then tackle the question of simultaneous cortical and subcortical activations. wMNE can detect hippocampal activations that are embedded in cortical activations that have less than double their amplitude, but it does not completely correct the bias to more superficial sources. dSPM and sLORETA can still detect hippocampal activity above this threshold, but such detection might include the creation of ghost deeper sources. Finally, using the DBA model, we showed that the detection of weak thalamic modulations of ongoing brain activity is possible.


Conflict of interest statement

Competing Interests: The authors have declared that no competing interests exist.

Figures

Figure 1
Figure 1. Simulation setup illustrations.
A. Schematic view of the simulation setup. The red and blue Gaussians correspond to the distributions that modulate the neocortical (respectively, subcortical) simulated fields that are generated from the activation of patches; these fields are illustrated with neocortical and hippocampal tessellations. The summation of both activations is used to estimate the actual generators. Dt is the time between the maximum of the two Gaussians. The variation in Dt allows variations in the ratio Rc between the cortical and the subcortical activations. B. The lower part displays the anatomical model that has the mentioned structures and is included to give to the reader a better idea of their positions. “P” stands for posterior and “A” anterior.
Figure 2
Figure 2. Simulated magnetic fields and sensitivity distributions.
A. Plot of normalized distributions (with fitted Gaussian distributions) of the simulated fields for patches of 3 cm2 that belong to the four structures. These distributions account for the DMD of each structure, the geometry of the patches and the gain matrix of the sources that belong to the patches. B. Normalized averaged sensitivity distributions (normalized average root mean-squared (RMS) contribution to sensors) over 7 subjects. The corresponding maps are displayed for the hippocampus and the amygdala. Note that the x-axis is logarithmic and that the colormap is scaled at the subcortical level to better evaluate the distributions of the subcortical sources. These distributions are calculated using the gain vector at each source location.
Figure 3
Figure 3. Point spread functions of hippocampus sources using wMNE.
The left side displays the PSF maps of three point sources (blue dots) using wMNE. Each PSF map is normalized (i.e., normalization of the given point source’s column of the resolution matrix) to better visualize each spatial distribution. By averaging the PSF maps over all of the hippocampus and after normalization, we obtain the PSF maps that are displayed on the right side. Note that the colorbar does not start from zero and that the structure sizes are modified to make the sources more visible. See Figure 1B for a medial view of the relative position of the structures.
Figure 4
Figure 4. Average PSF and CTF maps over all hippocampus sources.
Average PSF (1st line) and CTF (2nd line) maps are shown for the three inverse kernels: wMNE, sLORETA and dSPM. Note that the colorbar does not start from zero and that the structure sizes are modified to make the sources more visible. See Figure 1B for a medial view of the relative position of the structures.
Figure 5
Figure 5. Monte Carlo Simulations of single activations.
A. DLEg (1st line) maps and DLEm (2nd line) for single activations over the hippocampus, amygdala and thalamic sources and across the seven subjects. The results are shown for the three inverse methods, wMNE (1st column), sLORETA (2nd column) and dSPM (3rd column). Note that the colorbar does not start from zero and that the structures sizes are modified to make the sources more visible. See Figure 1B for a medial view of the relative position of the structures. B. Histograms of DLEg (x-axis in cm) distributions for all sizes of hippocampus patches (1 to 5 cm2). Note that the y-axes are normalized to be comparable.
Figure 6
Figure 6. Two estimated maps of activations.
Estimated normalized current maps for the three methods (columns). The actual patches are defined as shown in Figure 1, with one patch in the hippocampus and one patch in the neocortex. The results are given for the case of subject one; the values of Dt and the ratio (Rc) are varied, where (Rc) is the ratio between the neocortical activation and the hippocampal activation. A blue dot is displayed on the maps at the local estimated maximum in a sphere of 4 cm radius. The right bottom side of each map shows the histogram of the relative proportion (in percentage) of the estimated activations in the Hippocampus (H), the amygdala (A) and the thalamus (T). Note that the colorbar does not start from zero and that the structure sizes are modified to make the sources more visible. See Figure 1B for a medial view of the relative position of the structures.
Figure 7
Figure 7. Thalamo-cortical modulations at rest.
Thalamo-cortical modulations contrasting resting state eyes opened/closed conditions with 7 subjects using wMNE. The upper left rectangle displays the averaged power spectral density (PSD) of opened (red)/closed (blue) MEG data, with a vertical band (gray area) in the alpha frequencies. The right neocortex and the thalamic (light blue) envelopes are superimposed on the MNI T1 MRI. The overlaid neocortical map shows t values with a threshold at p<0.05, which are FDR corrected. Thalamic sources that pass the threshold are displayed with blue spheres, where the sizes are proportional to the estimated amplitudes.

References

    1. Baillet S, Mosher JC, Leahy RM (2001) Electromagnetic brain mapping. Signal Processing Magazine, IEEE 18: 14–30.
    1. Hillebrand A, Barnes GR (2002) A quantitative assessment of the sensitivity of whole-head MEG to activity in the adult human cortex. NeuroImage 16: 638–650. - PubMed
    1. Guy C, Walker S, Alarcon G, Binnie C, Chesterman P, et al. (1993) MEG and EEG in epilepsy: is there a difference? Physiol Meas 14 (Suppl. 4A)A99–A102. - PubMed
    1. Tesche C (1996) Non-invasive imaging of neuronal population dynamics in human thalamus. Brain research 729: 253–258. - PubMed
    1. Mikuni N, Nagamine T, Ikeda A, Terada K, Taki W, et al. (1997) Simultaneous Recording of Epileptiform Discharges by MEG and Subdural Electrodes in Temporal Lobe Epilepsy. NeuroImage 5: 298–306. - PubMed

Publication types