. 2013;8(3):e59928.
doi: 10.1371/journal.pone.0059928. Epub 2013 Mar 19.

Generation and characterization of a novel mouse embryonic stem cell line with a dynamic reporter of Nanog expression

Affiliations

Generation and characterization of a novel mouse embryonic stem cell line with a dynamic reporter of Nanog expression

Elsa Abranches et al. PLoS One. 2013.

Erratum in

  • PLoS One. 2014;9(6):e101028

Abstract

Background: The pluripotent state in embryonic stem (ES) cells is controlled by a core network of transcription factors that includes Nanog, Oct4 and Sox2. Nanog is required to reach pluripotency during somatic reprogramming and is the only core factor whose overexpression is able to oppose differentiation-promoting signals. Additionally, Nanog expression is known to fluctuate in ES cells, and different levels of Nanog seem to correlate with ES cells' ability to respond to differentiation promoting signals. Elucidating how dynamic Nanog levels are regulated in pluripotent cells and modulate their potential is therefore critical to develop a better understanding of the pluripotent state.

Methodology/principal findings: We describe the generation and validation of a mouse ES cell line with a novel Nanog reporter (Nd, from Nanog dynamics), containing a BAC transgene where the short-lived fluorescent protein VNP is placed under Nanog regulation. We show that Nanog and VNP have similar half-lives, and that Nd cells provide an accurate and measurable read-out for the dynamic levels of Nanog. Using this reporter, we could show that ES cells with low Nanog levels indeed have higher degree of priming to differentiation, when compared with high-Nanog cells. However, low-Nanog ES cells maintain high levels of Oct4 and Sox2 and can revert to a state of high-Nanog expression, indicating that they are still within the window of pluripotency. We further show that the observed changes in Nanog levels correlate with ES cell morphology and that Nanog dynamic expression is modulated by the cellular environment.

Conclusions/significance: The novel reporter ES cell line here described allows an accurate monitoring of Nanog's dynamic expression in the pluripotent state. This reporter will thus be a valuable tool to obtain quantitative measurements of global gene expression in pluripotent ES cells in different states, allowing a detailed molecular mapping of the pluripotency landscape.


Conflict of interest statement

Competing Interests: Domingos Henrique is a PLOS ONE Editorial Board member and that this does not alter the authors' adherence to all the PLOS ONE policies on sharing data and materials.

Figures

Figure 1
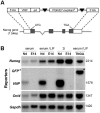
Figure 1. Nanog:VNP reporter cassette and Northern blot analysis of E14tg2a, TNG-A and Nd ES cell lines.
(A) Scheme of the recombination cassette containing the VNP cDNA and a neomycin resistance gene, inserted into the BAC (clone RP24-464B14) downstream of the Nanog starting codon. (B) Northern blot analysis of E14tg2a (E14) Nd and TNG-A ES cells probed for Nanog, Oct4, Gapdh (housekeeping gene) and reporter mRNAs, in self-renewal (serum/LIF and 2i) and differentiation (serum) conditions. Transcript sizes are indicated on the right. Higher levels of Nanog RNA are detected for both E14 and Nd ES cells in 2i conditions, compared to serum/LIF, while Oct4 is highly expressed in both cases. VNP mRNA is only detected in Nd ES cells. In differentiation conditions (serum alone), Nanog, Oct4 and VNP mRNA expression is strongly reduced. GFP* refers to the fusion transcript present in TNG-A ES cells, arising from the recombination of a GFP cDNA into the Nanog locus . This fusion transcript has a similar size to the endogenous Nanog mRNA expressed from the other allele.
Figure 2
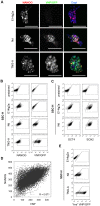
Figure 2. NOS network and reporters expression for cell lines grown in serum/LIF conditions.
(A) Immunofluorescence detection for Nanog (red) and VNP/GFP (green) in E14tg2a, Nd and TNG-A cell lines; nuclei counterstained with DAPI (blue). Nanog expression is observed in approximately 50% of cells for all cell lines, while VNP is expressed in the same percentage of Nd cells, with a high degree of co-localization. Higher number of GFP positive cells than Nanog-positive is observed for TNG-A cells. Scale-bar = 50 um. (B) Representative dot blots for FC-IS analysis of Nanog and VNP/GFP for E14tg2a, Nd and TNG-A cells. Negative controls (samples with no primary antibody) for both Nanog and VNP/GFP staining’s are shown, based on which the positive gate regions were designed. Nanog expression is similar between different cell lines grown in the same media. In Nd cells, VNP levels mimic Nanog expression in both culture conditions, while in TNG-A cells, GFP levels are much higher than Nanog levels, most likely due to reporter stability. (C) Representative dot blots for FC-IS analysis of Oct4 and Sox2 for E14tg2a and Nd. Negative controls (samples with no primary antibody) for both Oct4 and Sox2 staining’s are shown, based on which the positive gate regions were designed. Oct4 and Sox2 levels are always expressed in more than 90% of the cells in both media conditions. (D) Correlation plot for Nanog and VNP proteins expression in Nd cells. Graph depicts data from 24906 cells from three biological replicates obtained by FC-IS. Statistical analysis indicates a high degree of correlation between the expression of both proteins (Pearson correlation = 0.647). (E) Representative dot blots for FC analysis of live VNP/GFP for E14tg2a, Nd and TNG-A cells grown. E14tg2a cells were used as negative controls, based on which positive gate regions were designed. Obtained data is similar to that obtained by FC-IS (C). Quantifications of (A–C,E) may be observed in Table 1.
Figure 3
Figure 3. Protein and RNA half-lives of different pluripotency and reporter genes.
(A) Western blot analysis for VNP/GFP, Nanog, Oct4and a-Tub proteins in Nd, E14tg2a and TNG-A ES cell lines, over 6 hours after protein synthesis inhibition by cycloheximide (6h DMSO corresponds to the control without cycloheximide addition). Column on the right indicates the decay times of the targeted proteins. (B) Representative quantitative RT-PCR graphs for Vnp, Nanog, Oct4 and Sox2 mRNAs, calculated over 6 hours after transcription inhibition with actinomycin D (averages and standard deviations of at least 2 independent experiments are shown). Half-lives calculated using these data are depicted on each graph in brackets. No statistically significant differences were observed between Nd and E14tg2a cell lines (p-values >0.15).
Figure 4
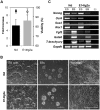
Figure 4. Pluripotency potential of the Nd ES cell line.
(A) Cell growth (bars), measured as fold increase, and viability (circles) for Nd and E14tg2a cell lines passaged every 48 h in serum/LIF conditions (n≥8). No statistically significant differences were observed between Nd and E14tg2a cell lines (p-values >0.09). (B) Bright field images of Nd and E14tg2a ES cells in grown in serum/LIF (ES cells growing in clusters), after 4 days of differentiation through EBs formation (cells growing as suspension aggregates), and after 8 days of monolayer neural differentiation (with formation of neural rosettes). Scale-bar = 200 um. (C) RT-PCR analysis of Nd and E14tg2a ES cells and corresponding day 4 EBs for known ES cell markers (Nanog, Oct4, Sox2 and Rex1) and ecto- (Fgf5), meso- (T-brachyury) and endoderm (Gata6) markers. Upon differentiation, pluripotency genes expression is downregulated while expression of markers from the three germ layers increase.
Figure 5
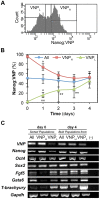
Figure 5. Nanog expression in FACS-sorted Nd ES cells.
(A) Representative histogram of FACS-sorted Nd sub-populations, grown in serum/LIF. VNP-low (VNPL) and VNP-high (VNPH) populations were collected for posterior analysis. (B) Nanog:VNP expression after re-plating sorted populations of Nd ES cells in serum/LIF. After 2–4 days, normal levels of heterogeneity are re-established, and expression of Nanog:VNP is similar between the three populations, either derived from the sorted VNPL and VNPH subsets, or from the whole population (“All”). Representative dot blots for FC analysis of VNP in non-fixed cells are presented in Figure S4. Statistically significant differences (p-value <0.05) observed between “All” and VNP sub-populations are denoted with (*), while statistically significant differences between VNPL and VNPH are denoted with (**). (C) mRNA expression analysis by RT-PCR of cells collected immediately after sorting (day 0) and four days after re-plating (day 4). The purified VNPL subpopulation (immediately after sorting) shows lower Nanog mRNA levels and higher expression of lineage-affiliated genes (Fgf5, Gata6 and T-brachyury). After culture for 4 days, both VNPL and VNPH subsets show similar Nanog mRNA expression. Expression of lineage markers in the VNPL subpopulation is still more elevated after 4 days of culture, most likely reflecting the slower reversion to heterogeneity (Figure S4). Similar levels of Oct4 and Sox2 expression are observed for all analysed samples.
Figure 6
Figure 6. NOS network and reporters expression for cell lines grown 2i conditions.
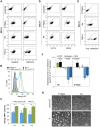
(A) Representative dot blots for FC-IS analysis of Nanog and VNP/GFP for E14tg2a, Nd and TNG-A cells grown in 2i. Negative controls (samples with no primary antibody) for both Nanog and VNP/GFP staining’s are shown, based on which the positive gate regions were designed. Nanog expression is similar between different cell lines grown in the same media, but it is highly increased (∼90%) when compared to serum/LIF conditions (∼55%, Figure 2B). In 2i media, both Nd and TNG-A cells reporter levels mimic Nanog expression. (B) Representative histogram showing Nanog:VNP expression for the Nd cell line grown in serum/LIF (blue) and in 2i (green). The negative control cells (E14tg2a) grown in the same conditions are represented in gray and black. In serum/LIF conditions, approximately 55% of the cells express Nanog:VNP, while this value increases to around 90% in 2i conditions. Despite this change in expression levels, a population of ES cells with no or low levels of Nanog is always observed (*). (C) Graph depicting Nanog:VNP expression data from three different biological replicates during three serial passages (P1, P2 and P3), for the Nd cell line grown in serum/LIF (blue) and in 2i (green). Statistically significant differences were consistently observed between serum/LIF and 2i conditions for all tested passages (*p-value <0.003), while no differences were detected for cells grown in the same culture media (p-value >0.20). (D) Representative dot blots for FC-IS analysis of Oct4 and Sox2 for E14tg2a and Nd. Negative controls (samples with no primary antibody) for both Oct4 and Sox2 staining’s are shown, based on which the positive gate regions were designed. Oct4 and Sox2 levels are always expressed in more than 90% of the cells in both media conditions. (E) Representative dot blots for FC analysis of live VNP/GFP for E14tg2a, Nd and TNG-A. E14tg2a cells were used as negative controls, based on which positive gate regions were designed. Obtained data is similar to that obtained by FC-IS (A). (F) Quantitative RT-PCR data for VNP, Nanog, Oct4, Sox2, Fgf5 and Dusp6 expression in E14tg2a and Nd cells. Expression levels in 2i conditions were normalized to Gapdh gene and are relative to expression levels in serum/LIF. While, for both cell lines, Oct4 and Sox2 expression does not change significantly (p-value >0.10), both VNP and Nanog expression levels show a 2–3 fold increase (*p-value <0.03). This change is accompanied by a decrease in the expression levels of Fgf5 and Dusp6 when FGF/ERK signaling is abolished (**p-value <5.8×10⁻⁶). No statistically significant differences were observed between E14tg2a and Nd cell lines (p-value >0.08). (G) Representative bright field images of Nd cell line grown in serum/LIF and in 2i. In 2i conditions, ES cells grow in more tightly packed colonies with reduced flattened differentiated-like cells. Quantifications of (A,D,E) may be observed in Table 1.
Figure 7
Figure 7. Morphology and Nanog:VNP levels correlation.
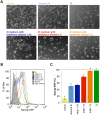
(A) Bright field images of Nd cells grown in different culture media: serum; serum/LIF; 2i; and 2i with reduced inhibitors (FGF/ERK and GSK3ß inhibitors) concentration (1∶10, 1∶5 and 1∶2). The addition of increasing amounts of inhibitors results in more tightly packed morphology of ES cell colonies and in the reduction in flattened differentiated cells and a more tightly packed morphology of ES cell colonies. When ES cells are grown in serum alone, the inverse is observed. (B) Representative FC histograms of Nanog:VNP expression for Nd cells grown in different culture media.The addition of increasing amounts of inhibitors results in the increasing expression of Nanog:VNP (to up 95%), while cell grown in serum alone decreases significantly Nanog:VNP expression (to around 15%). The negative control cells (E14tg2a) are represented in gray. (C) Nanog:VNP expression quantifications for Nd cells grown in different culture media (n = 3). Statistically significant differences (p-value <0.002) observed between “serum/LIF” and other conditions are denoted with (*).

References

    1. Potten CS, Loeffler M (1990) Stem cells: attributes, cycles, spirals, pitfalls and uncertainties. Lessons for and from the crypt. Development 110: 1001–1020. - PubMed
    1. Morrison SJ, Shah NM, Anderson DJ (1997) Regulatory mechanisms in stem cell biology. Cell 88: 287–298. - PubMed
    1. Martin GR (1981) Isolation of a pluripotent cell line from early mouse embryos cultured in medium conditioned by teratocarcinoma stem cells. Proceedings of the National Academy of Sciences of the United States of America 78: 7634–7638. - PMC - PubMed
    1. Evans MJ, Kaufman MH (1981) Establishment in culture of pluripotential cells from mouse embryos. Nature 292: 154–156. - PubMed
    1. Smith AG (2001) Embryo-derived stem cells: of mice and men. Annu Rev Cell Dev Biol 17: 435–462. - PubMed

Publication types