. 2013;8(3):e60141.
doi: 10.1371/journal.pone.0060141. Epub 2013 Mar 20.

Alternating hemiplegia of childhood-related neural and behavioural phenotypes in Na+,K+-ATPase α3 missense mutant mice

Affiliations

Alternating hemiplegia of childhood-related neural and behavioural phenotypes in Na+,K+-ATPase α3 missense mutant mice

Greer S Kirshenbaum et al. PLoS One. 2013.

Abstract

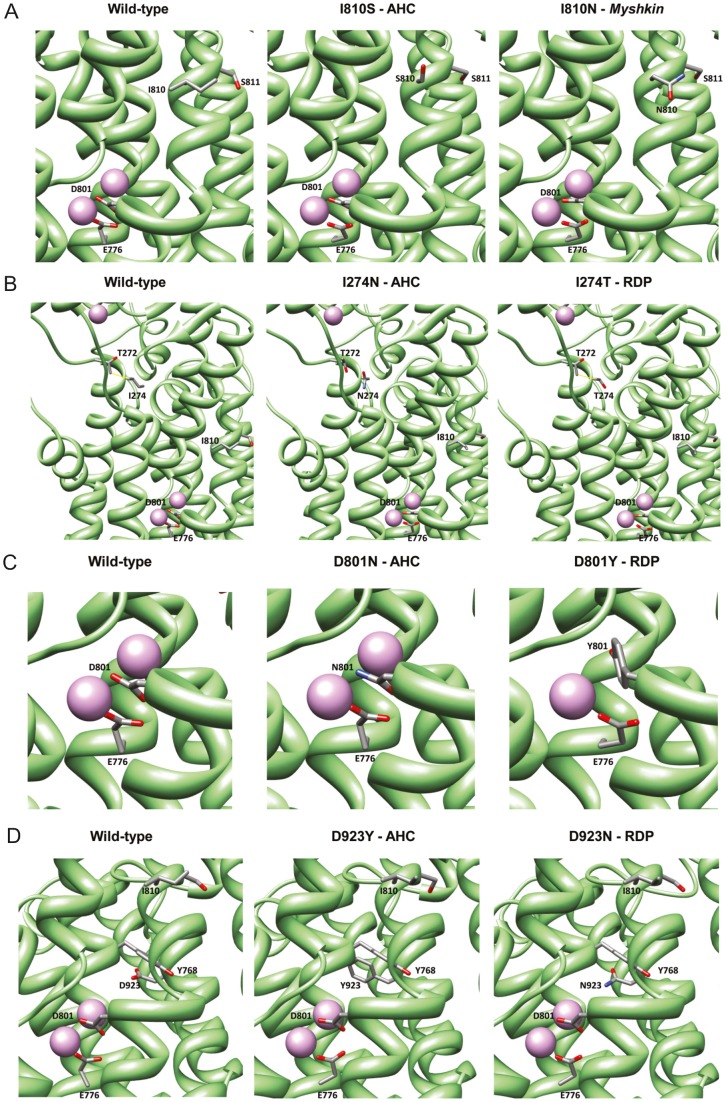
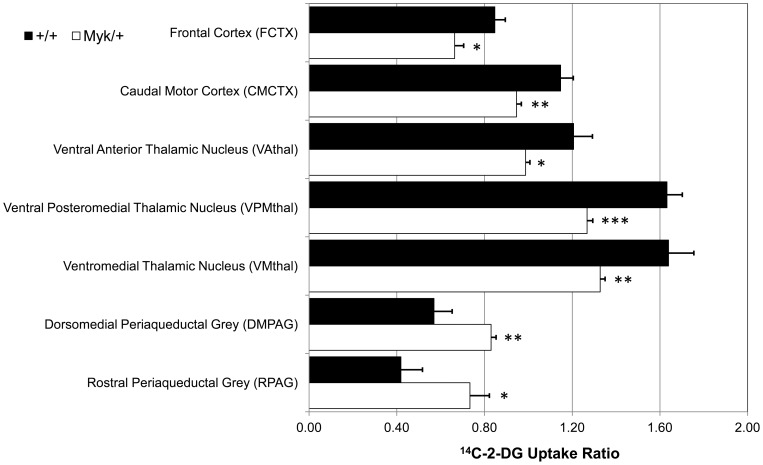
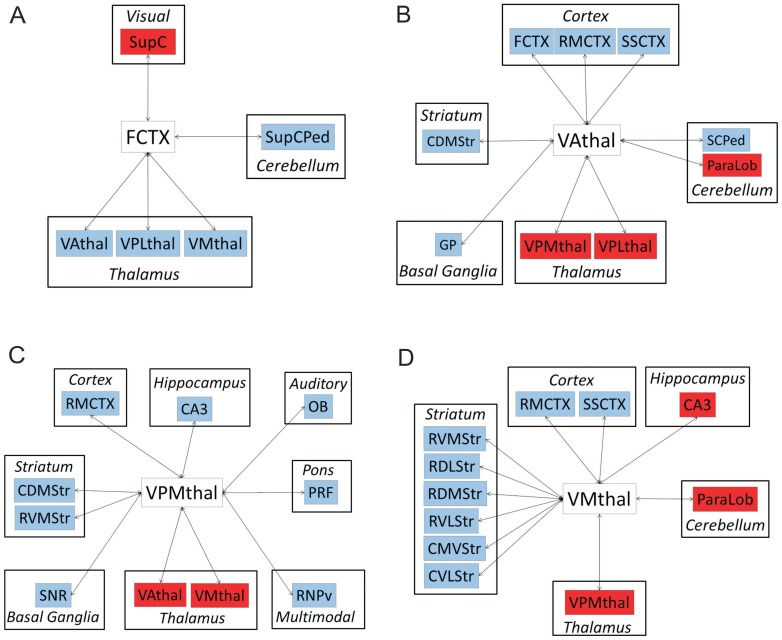
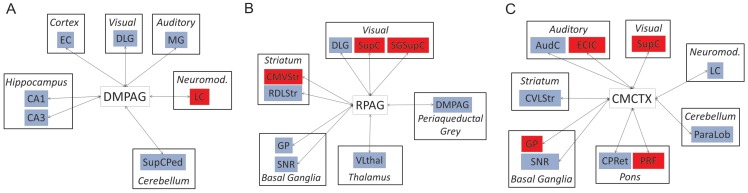
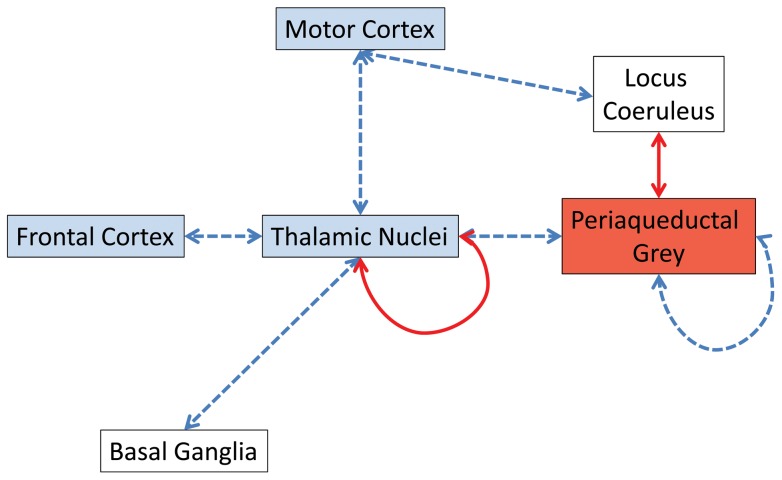
Missense mutations in ATP1A3 encoding Na(+),K(+)-ATPase α3 have been identified as the primary cause of alternating hemiplegia of childhood (AHC), a motor disorder with onset typically before the age of 6 months. Affected children tend to be of short stature and can also have epilepsy, ataxia and learning disability. The Na(+),K(+)-ATPase has a well-known role in maintaining electrochemical gradients across cell membranes, but our understanding of how the mutations cause AHC is limited. Myshkin mutant mice carry an amino acid change (I810N) that affects the same position in Na(+),K(+)-ATPase α3 as I810S found in AHC. Using molecular modelling, we show that the Myshkin and AHC mutations display similarly severe structural impacts on Na(+),K(+)-ATPase α3, including upon the K(+) pore and predicted K(+) binding sites. Behavioural analysis of Myshkin mice revealed phenotypic abnormalities similar to symptoms of AHC, including motor dysfunction and cognitive impairment. 2-DG imaging of Myshkin mice identified compromised thalamocortical functioning that includes a deficit in frontal cortex functioning (hypofrontality), directly mirroring that reported in AHC, along with reduced thalamocortical functional connectivity. Our results thus provide validation for missense mutations in Na(+),K(+)-ATPase α3 as a cause of AHC, and highlight Myshkin mice as a starting point for the exploration of disease mechanisms and novel treatments in AHC.


Conflict of interest statement

Competing Interests: The authors have declared that no competing interests exist.

Figures

Figure 1
Figure 1. Structural modelling of Na+,K+-ATPase α3 mutations.
(A) Na+,K+-ATPase α3 wild-type (left), the I810S mutant (AHC; centre) and the I810N mutant (Myshkin; right). (B) Na+,K+-ATPase α3 wild-type (left), the I274N mutant (AHC; centre) and the I274T mutant (RDP; right). Side chain contact between Δ272 and Δ274 at the cytoplasmic end of the K+ pore is shown in yellow for the wild-type protein and the I274T mutant, but this contact is lost in the I274N mutant. (C) Na+,K+-ATPase α3 wild-type (left), the D801N mutant (AHC; centre) and D801Y mutant (RDP; right). In the D801N mutant, the electrostatic interaction at Δ801 with both K+ ions is lost due to replacement of terminal oxygen with nitrogen, resulting in the obstruction of the K+ pore, likely to markedly affect conductance rates through the pore, while the interaction of K+2 with E776 is maintained. In the D801Y mutant, there is a predicted loss of interaction of K+2 with E776. (D) Na+,K+-ATPase α3 wild-type (left), the D923Y mutant (AHC; centre) and the D923N mutant (RDP; right).
Figure 2
Figure 2. Motor dysfunction in Myk/+ mice.
(A) Gait analysis. Left panel: Mean fore stride and hind stride distance (± SEM) per cm trunk of Myk/+ (n = 14) and +/+ (n = 17) female mice. There were significant main effects of genotype on fore stride length (F 1,30 = 5.59, P = 0.025), hind stride length (F 1,30 = 8.09, P = 0.008) and hind stride width (F 1,30 = 24.44, P = 0.0001) (left panel). Middle panel: Typical examples of forepaw (red) and hindpaw (blue) placement of Myk/+ and +/+ mice are shown. Scale bar  = 2 cm. Right panel: Myk/+ mouse showing splayed hindlimbs. (B) Balance beam. Mean number of foot slips (left panel) and traversal time (right panel) (± SEM) of Myk/+ (n = 26) and +/+ (n = 45) mice when traversing a narrow beam 24 hours after training. There were significant main effects of genotype on number of foot slips (F 1,70 = 99.46, P = 0.0001) and traversal time (F 1,70 = 43.38, P = 0.0001). (C) Tail suspension. Mean hindlimb retraction score (± SEM) of Myk/+ (n = 26) and +/+ (n = 26) mice suspended by the tail for 30 s. There was a significant main effect of genotype (F 1,51 = 29.00, P = 0.0001). Hindlimb retraction is defined as the movement of one of both hindlimbs into the central body axis (photograph). (D) Accelerating rotarod. Mean latency (± SEM) of Myk/+ (n = 18) and +/+ (n = 21) mice to fall from a rotating rod over three training trials. There were significant main effects of sex (F 1,38 = 9.94, P = 0.003) and genotype (F 1,38 = 6.09, P = 0.019), but not genotype x sex interaction (F 1,38 = 0.91, P = 0.346), females performing better than males regardless of genotype. (E) Tremor. Mean amplitude of displacement (± SEM) of Myk/+ (n = 36) and +/+ (n = 52) mice across a spectrum of frequencies. There was a significant main effect of genotype on frequency at the maximal amplitude (F 1,87 = 57.1, P = 0.0001). *P<0.05; **P<0.01; ****P<0.0001 versus +/+ mice.
Figure 3
Figure 3. Cognitive impairment in Myk/+ mice.
(A) Fear conditioning with 1.0-mA footshock. Mean freezing levels (± SEM) of Myk/+ (n = 24) and +/+ (n = 25) mice at baseline, during training, and in the contextual and cued conditioning tests. There were significant main effects of genotype on freezing in the context test (F 1,48 = 8.52, P = 0.005) and in the cue test during presentation of the auditory tone (CS; F 1,48 = 6.20, P = 0.016). (B) Conditioned taste aversion. Mean (± SEM) CS consumption scores (intake of saccharin/total fluid) 24 h following pairing with LiCl or saline treatment in Myk/+ and +/+ mice. There were significant main effects of genotype (F 1,47 = 6.51, P = 0.014), treatment (F 1,47 = 48.12, P = 0.0001), and genotype x treatment interaction (F 1,47 = 4.09, P = 0.049). *P<0.05; ***P<0.001; ****P<0.0001 versus +/+ mice.
Figure 4
Figure 4. Significant alterations in overt local cerebral glucose utilization in Myk/+ mice.
Data shown as mean ± SEM of the 14C-2-DG uptake ratio. *denotes P<0.05, **denotes P<0.01 and ***denotes P<0.001 significant genotype effect (Welch's t-test).
Figure 5
Figure 5. Thalamocortical, thalamostriatal and intrathalamic functional connectivity in Myk/+ mice.
Summary diagrams showing altered functional connectivity of (A) frontal cortex (FCTX), (B) ventral anterior thalamic nucleus (VAthal), (C) ventromedial thalamic nucleus (VMthal), and (D) ventral posteromedial nucleus (VPMthal) in Myk/+ mice. Only regions where the 95% CI of the VIP exceeded 0.80, in either Myk/+ or +/+ mice, were considered to be functionally connected to the defined “seed” region of interest. The I810N Myshkin mutation-induced alterations in functional connectivity were analysed by permutation test (1000 random permutations of the real data) with significance set at P<0.05. Red denotes a significant increase, whereas blue denotes a significant decrease, in regional functional connectivity in Myk/+ mice relative to +/+.
Figure 6
Figure 6. Altered periaqueductal grey and caudal motor cortex functional connectivity in Myk/+ mice.
Summary diagrams showing altered functional connectivity of (A) dorsomedial (DMPAG) and (B) rostral (RPAG) periaqueductal grey, and (C) caudal motor cortex (CMCTX) in Myk/+ mice. Only regions where the 95% CI of the VIP exceeded 0.80, in either Myk/+ or +/+ mice, were considered to be functionally connected to the defined “seed” region of interest. The I810N Myshkin mutation-induced alterations in functional connectivity were analysed by permutation test (1000 random permutations of the real data) with significance set at P<0.05. Red denotes a significant increase, whereas blue denotes a significant decrease, in regional functional connectivity in Myk/+ mice relative to +/+.
Figure 7
Figure 7. Summary diagram of alterations in brain system functional connectivity and overt alterations in regional cerebral glucose metabolism seen in Myk/+ mice.
Blue shading of neural systems indicates a significant decrease in overt cerebral metabolism while red denotes a significant increase in overt cerebral metabolism (Figure 4). Blue/broken arrows indicate a decrease in functional connectivity between and within (periaqueductal grey subfields) neural systems in Myk/+ mice relative to +/+ littermates. Red/solid arrows indicate increased functional connectivity between and within (thalamic nuclei) neural systems in Myk/+ mice relative to +/+ littermates.

References

    1. Neville BG, Ninan M (2007) The treatment and management of alternating hemiplegia of childhood. Dev Med Child Neurol 49: 777–780. - PubMed
    1. Silver K, Andermann F (1993) Alternating hemiplegia of childhood: a study of 10 patients and results of flunarizine treatment. Neurology 43: 36–41. - PubMed
    1. Sweney MT, Silver K, Gerard-Blanluet M, Pedespan JM, Renault F, et al. (2009) Alternating hemiplegia of childhood: early characteristics and evolution of a neurodevelopmental syndrome. Pediatrics 123: e534–e541. - PubMed
    1. Panagiotakaki E, Gobbi G, Neville B, Ebinger F, Campistol J, et al. (2010) Evidence of a non-progressive course of alternating hemiplegia of childhood: study of a large cohort of children and adults. Brain 133: 3598–3610. - PubMed
    1. Sasaki M, Sakuma H, Fukushima A, Yamada K, Ohnishi T, et al. (2009) Abnormal cerebral glucose metabolism in alternating hemiplegia of childhood. Brain Dev 31: 20–26. - PubMed

Publication types

Substances

Supplementary concepts