. 2013 Mar 19;104(6):1367-79.
doi: 10.1016/j.bpj.2013.02.012. Epub 2013 Mar 19.

Minimal models for cell-cycle control based on competitive inhibition and multisite phosphorylations of Cdk substrates

Affiliations

Minimal models for cell-cycle control based on competitive inhibition and multisite phosphorylations of Cdk substrates

Claude Gérard et al. Biophys J. .

Abstract

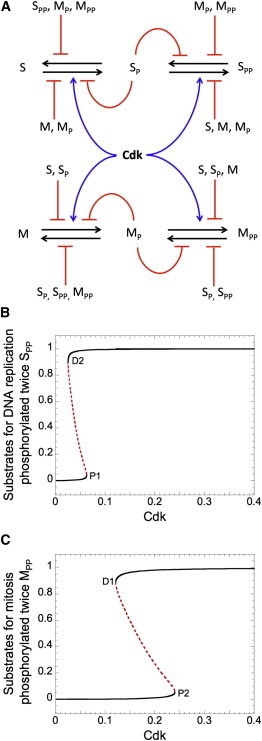
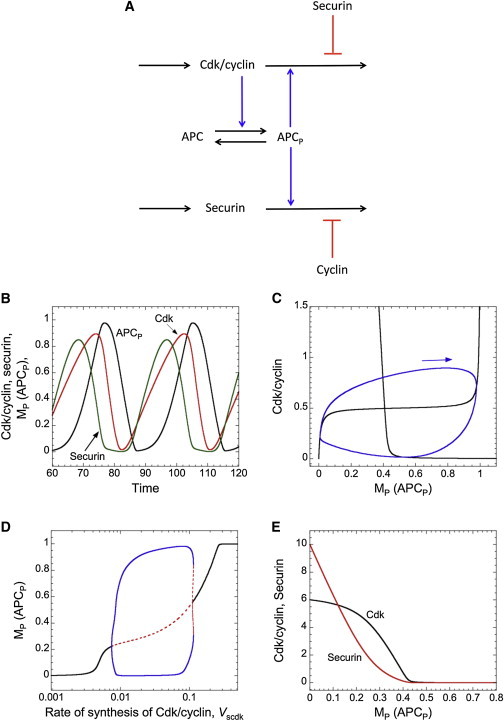
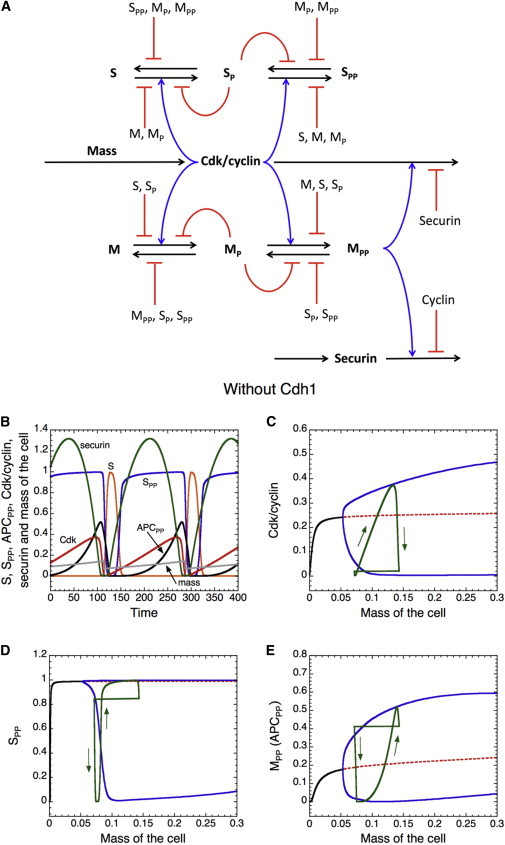
The eukaryotic cell cycle is characterized by alternating oscillations in the activities of cyclin-dependent kinase (Cdk) and the anaphase-promoting complex (APC). Successful completion of the cell cycle is dependent on the precise, temporally ordered appearance of these activities. A modest level of Cdk activity is sufficient to initiate DNA replication, but mitosis and APC activation require an elevated Cdk activity. In present-day eukaryotes, this temporal order is provided by a complex network of regulatory proteins that control both Cdk and APC activities via sharp thresholds, bistability, and time delays. Using simple computational models, we show here that these dynamical features of cell-cycle organization could emerge in a control system driven by a single Cdk/cyclin complex and APC wired in a negative-feedback loop. We show that ordered phosphorylation of cellular proteins could be explained by multisite phosphorylation/dephosphorylation and competition of substrates for interconverting kinase (Cdk) and phosphatase. In addition, the competition of APC substrates for ubiquitylation can create and maintain sustained oscillations in cyclin levels. We propose a sequence of models that gets closer and closer to a realistic model of cell-cycle control in yeast. Since these models lack the elaborate control mechanisms characteristic of modern eukaryotes, they suggest that bistability and time delay may have characterized eukaryotic cell divisions before the current cell-cycle control network evolved in all its complexity.


Figures

Figure 1
Figure 1
Scheme of a minimal model for the ordered progression of DNA replication and mitosis. (A) Model containing two groups of substrates (S and M) that can each be phosphorylated once by a Cdk/cyclin complex. Phosphorylation of S promotes progression into DNA replication, whereas phosphorylation of M brings about the entry into mitosis. The dynamics of the model is based on substrate competition between S and M for phosphorylation by Cdk and between SP and MP for dephosphorylation by PPase. In this version of the model, as well as in all models of this study, the kinetics of phosphorylation/dephosphorylation are described by a Goldbeter-Koshland switch (13). (B and C) Bifurcation diagrams of the phosphorylated substrates for DNA replication, SP (B), and mitosis, MP (C), as functions of Cdk activity. In both cases, low Cdk activity results in low levels of SP and MP (the G1 state), whereas high Cdk activity promotes full phosphorylation of S and M (the S/G2/M state). For intermediate Cdk activity, the model exhibits bistability in the phosphorylation of S and M. As Cdk activity rises from 0.1 to 0.25 along the lower branch of the bistable switch, the S substrates become significantly phosphorylated (B), whereas the M substrates remain unphosphorylated (C), which suggests that cells enter the S phase (DNA synthesis) before they commit to mitosis. However, as soon as Cdk activity exceeds ∼0.26, M substrates are abruptly phosphorylated and the cell enters mitosis. Parameter values for the simulations are given in Section 1 of Supplement 1 in the Supporting Material.
Figure 2
Figure 2
A model for the ordered progression of DNA replication and mitosis based on double phosphorylation of S and M substrates. (A) A kinase, Cdk, can phosphorylate twice the substrates required for DNA replication, S, and mitosis, M. The unphosphorylated (S and M) or monophosphorylated (SP and MP) substrates compete for phosphorylation by the kinase, while the monophosphorylated and twice-phosphorylated (SPP and MPP) substrates compete for dephosphorylation by the counteracting PPase. (B and C) Bifurcation diagrams of SPP and MPP as functions of Cdk activity. As Cdk activity increases from 0, the system passes through two domains of bistability. At the edge of the first domain (Cdk ≈ 0.06), the S substrates become fully phosphorylated and the cell commences DNA replication. Only later, when Cdk activity increases beyond the edge of the second bistability domain (Cdk ≈ 0.24) do the M substrates become fully phosphorylated, at which point the cell enters mitosis. Parameter values for these simulations are given in Section 2 of Supplement 1 in the Supporting Material.
Figure 3
Figure 3
Two-parameter bifurcation diagrams (k1M versus Cdk) for the models in Figs. 1 and 2. (A) The model with singly phosphorylated substrates has a single domain of bistability. (B) The model with doubly phosphorylated substrates has two domains of bistability. Regions where the steady-state levels of phosphorylated substrates (SP and MP in A and SPP and MPP in B) are high or low are indicated. Other parameter values used in these calculations are given in Supplement 1 of the Supporting Material.
Figure 4
Figure 4
A minimal, embryonic-type cell-cycle oscillator. (A) Scheme of a three-variable oscillator based on negative feedback between Cdk/cyclin and APC. Cdk ensures the phosphorylation of APC, which then promotes the degradation of Cdk/cyclin. A time delay is introduced by competitive inhibition between Cdk/cyclin and securin for polyubiquitylation by APC. (B) Time course of sustained oscillations of Cdk/cyclin, securin, and the phosphorylated form of APC. (C) The limit cycle (closed curve) is projected onto the Cdk/cyclin versus APCP plane. The arrow indicates the direction of motion along the limit cycle. Black curves are the Cdk/cyclin and APCP nullclines. (D) Bifurcation diagram. APCP as a function of the rate of synthesis of Cdk/cyclin, Vscdk. Solid curves indicate stable steady states (for low and high values of Vscdk) and stable limit cycles (for intermediate values of Vscdk); dashed curves indicate unstable steady states and unstable oscillations. (E) Cdk/cyclin and securin nullclines when APCP is considered as a parameter. Parameter values for the simulations are given in Section 3 of Supplement 1 in the Supporting Material.
Figure 5
Figure 5
Minimal oscillator with two steps of phosphorylation and dephosphorylation of M substrates (namely, APC). (A) Schematic diagram. Cdk/cyclin phosphorylates M and MP, and the doubly phosphorylated form of M (MPP) promotes the degradation of Cdk/cyclin. The different phosphoforms of M compete for phosphorylation by Cdk and dephosphorylation by PPase. (B and C) Time evolution of Cdk/cyclin, securin, and MPP in the presence or absence, respectively, of securin. (D and E) For the cases with and without securin, the limit cycle (closed curve) is projected onto the APCPP-versus-Cdk/cyclin phase plane. The S-shaped curve is the APCPP nullcline. For intermediate values of Cdk/cyclin, a region of bistability is present in the phosphorylation state of APC, whether or not securin is present. Arrows indicate the direction of motion along the limit cycle. (F and G) Bifurcation diagrams for MPP versus Vscdk in the presence or absence, respectively, of securin. Solid curves indicate stable steady states or maxima and minima of the sustained oscillations, and dashed curves indicate unstable states. With securin present, the limit-cycle region is bounded by a SNIC bifurcation at Vscdk ≈ 0.005 and a Hopf bifurcation at Vscdk ≈ 0.15. In the absence of securin, sustained oscillations are still possible, and in this case, the limit-cycle region is bounded by two Hopf bifurcations. Parameter values for the simulations are given in Section 4 of Supplement 1 in the Supporting Material.
Figure 6
Figure 6
A model of Cdk oscillations with sequential activation of DNA replication and mitosis. (A) Schematic diagram, combining the basic features of Figs. 2A and 4A. Two types of substrate competition are present in this model: 1), competitive inhibition between the different phosphoforms of S and M substrates for Cdk and its counteracting PPase; and 2), competitive inhibition between Cdk/cyclin and securin for ubiquitylation by active APC (APCPP). Growth control of the cell cycle is incorporated by assuming that the rate of synthesis of Cdk/cyclin is proportional to the mass of the cell. (B) Time courses of Cdk/cyclin, S, SPP, APCPP, securin, and cell mass. In these simulations, mass increases exponentially with a doubling time of 190 time units. The rate of cyclin synthesis, Vscdk in Eq. 7, is multiplied by mass to couple cyclin accumulation to cell growth. Binary cell division is assumed to occur when Cdk drops below a chosen threshold (0.02) at the end of mitosis. Phosphorylation of S, i.e., initiation of DNA replication, precedes phosphorylation of APC, i.e., entry into mitosis. (CE) Bifurcation diagrams of Cdk/cyclin, SPP, and APCPP are shown as functions of cell mass, considered as a parameter. Solid curves indicate stable steady states or maxima and minima of the sustained oscillations, dashed curves indicate unstable states, and closed curves indicate cell-cycle trajectory from B. Parameter values for the simulations are given in section 5 of Supplement 1 in the Supporting Material.
Figure 7
Figure 7
Dynamical behavior of the final model with Cdh1 as an S substrate. (A) Schematic diagram. (B) Time courses of Cdk/cyclin, S (Cdh1), SPP (Cdh1PP), APCPP, securin, and cell mass. Notice that Cdh1 allows an extended G1 phase where S is unphosphorylated (compare Fig. 7B with Fig. 6B). In this case, terms for Cdk degradation by Cdh1, kdcdk2×Cdk×S, and for securin degradation by Cdh1, kdsec2×Sec×S, are added to Eqs. 7 and 9, respectively. (CE) Bifurcation diagrams of Cdk/cyclin, SPP, and APCPP are plotted as functions of cell mass, considered as a parameter. Superimposed on these bifurcation diagrams are the limit-cycle oscillations (closed curve) in B. Parameter values for the simulations are given in section 5 of Supplement 1 in the Supporting Material.

Similar articles

Cited by

References

    1. Fisher D.L., Nurse P. A single fission yeast mitotic cyclin B p34cdc2 kinase promotes both S-phase and mitosis in the absence of G1 cyclins. EMBO J. 1996;15:850–860. - PMC - PubMed
    1. Stern B., Nurse P. A quantitative model for the cdc2 control of S phase and mitosis in fission yeast. Trends Genet. 1996;12:345–350. - PubMed
    1. Coudreuse D., Nurse P. Driving the cell cycle with a minimal CDK control network. Nature. 2010;468:1074–1079. - PubMed
    1. Uhlmann F., Bouchoux C., López-Avilés S. A quantitative model for cyclin-dependent kinase control of the cell cycle: revisited. Philos. Trans. R. Soc. Lond. B Biol. Sci. 2011;366:3572–3583. - PMC - PubMed
    1. Oikonomou C., Cross F.R. Rising cyclin-CDK levels order cell cycle events. PLoS ONE. 2011;6:e20788. - PMC - PubMed

Publication types

MeSH terms

Substances