. 2013 May;40(4):498-506.
doi: 10.1016/j.nucmedbio.2012.12.013. Epub 2013 Mar 23.

Radiosynthesis and biological evaluation of alpha-[F-18]fluoromethyl phenylalanine for brain tumor imaging

Affiliations

Radiosynthesis and biological evaluation of alpha-[F-18]fluoromethyl phenylalanine for brain tumor imaging

Chaofeng Huang et al. Nucl Med Biol. 2013 May.

Abstract

Objectives: Radiolabeled amino acids have proven utility for imaging brain tumors in humans, particularly those that target system L amino acid transport. We have prepared the novel phenylalanine analogue, (FMePhe, 9), as part of an effort to develop new system L tracers that can be prepared in high radiochemical yield through nucleophilic [(18)F]fluorination. The tumor imaging properties of both enantiomers of this new tracer were evaluated through cell uptake, biodistribution and microPET studies in the mouse DBT model of high grade glioma.

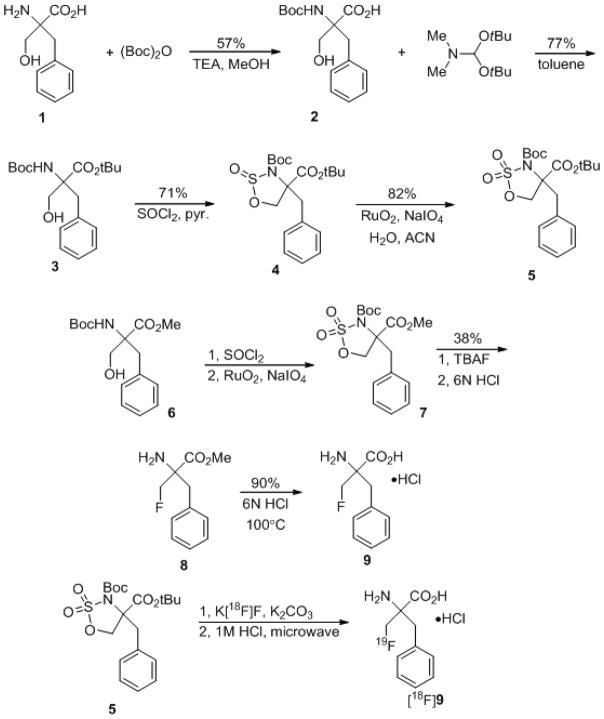
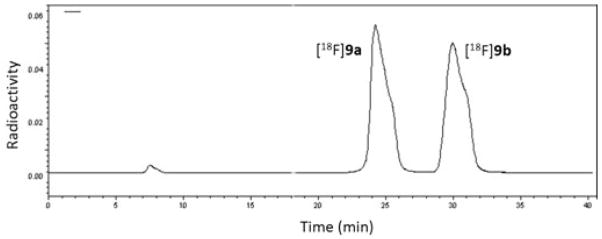
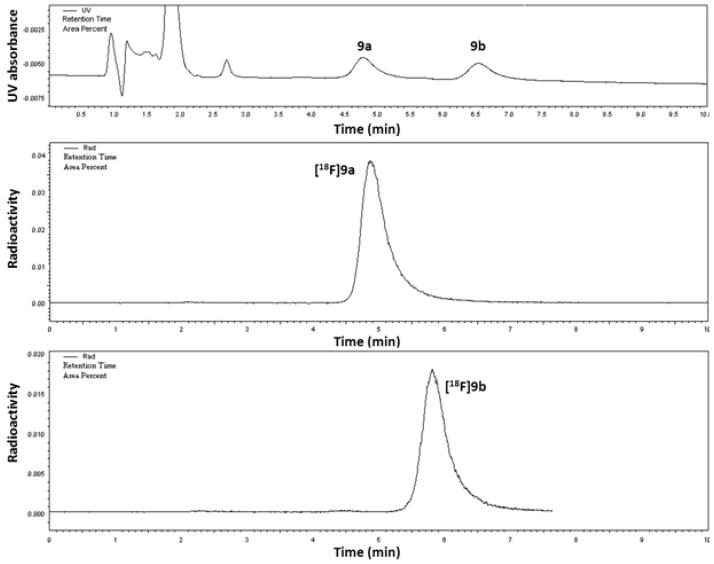
Methods: The non-radioactive form of 9 and the cyclic sulfamidate labeling precursor were prepared from commercially available racemic α-benzylserine. Racemic [(18)F]9 was prepared from the labeling precursor in two steps using standard[(18)F]fluoride nucleophilic reaction conditions followed by acidic deprotection. The individual enantiomers [(18)F]9a and [(18)F]9b were isolated using preparative chiral HPLC. In vitro uptake inhibition assays were performed with each enantiomer using DBT cells. Biodistribution and microPET/CT studies were performed with each enantiomer in male BALB/c mice at approximately 2 weeks after implantation of DBT tumor cells.

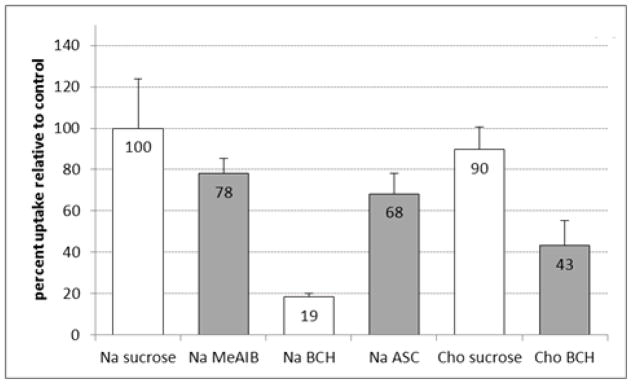
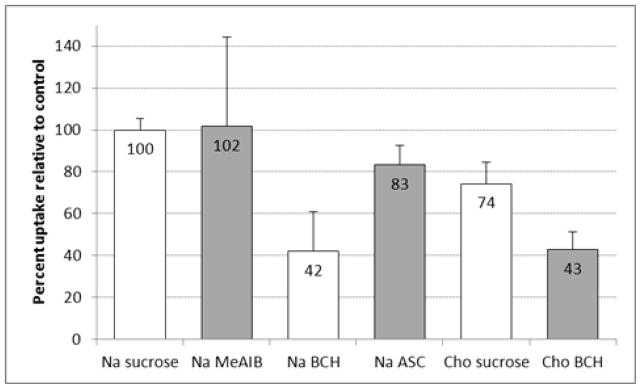
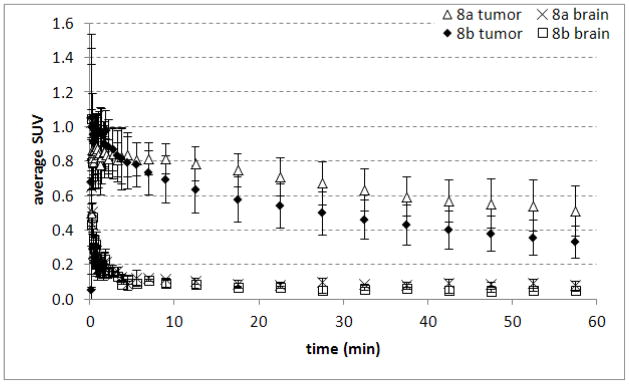
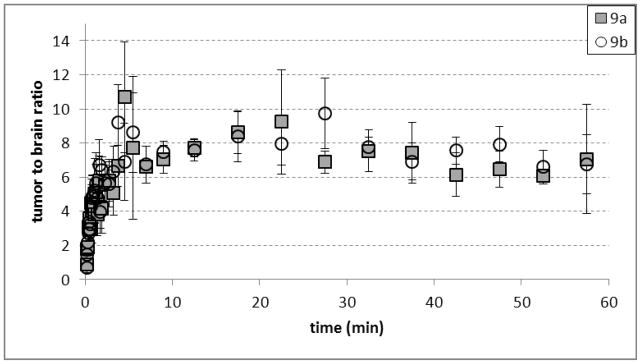
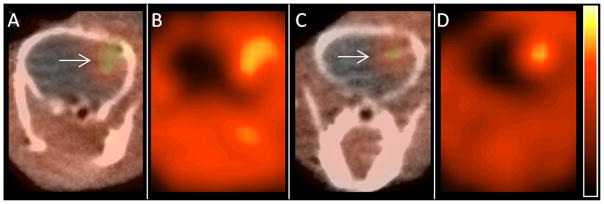
Results: Radiolabeling of the cyclic sulfamidate precursor 5 provides racemic [(18)F]9 in high radiochemical yield (60%-70%, n=4) and high radiochemical purity (>96%, n=4). In vitro uptake assays demonstrate that both [(18)F]9a and [(18)F]9b undergo tumor cell uptake through system L transport. The biodistribution studies using the single enantiomers [(18)F]9a and [(18)F]9b demonstrated good tumor uptake with lower uptake in most normal tissues, and [(18)F]9a had higher tumor uptake than [(18)F]9b. MicroPET imaging demonstrated good tumor visualization within 10 min of injection, rapid uptake of radioactivity, and tumor to brain ratios of approximately 6:1 at 60 min postinjection.

Conclusions: The novel PET tracer, [(18)F]FMePhe, is readily synthesized in good yield from a cyclic sulfamidate precursor. Biodistribution and microPET studies in the DBT model demonstrate good tumor to tissue ratios and tumor visualization, with enantiomer [(18)F]9a having higher tumor uptake. However, the brain availability of both enantiomers was lower than expected for system L substrates, suggesting the [(18)F]fluorine group in the β-position affects uptake of these compounds by system L transporters.


Figures

Figure 1
Figure 1
Preparation of the non-radioactive and 18F-labeled forms of 9.
Figure 2
Figure 2
Preparative chiral HPLC separation of the single enantiomers [18F]9a and [18F]9b. Refer to the methods section for HPLC conditions.
Figure 3
Figure 3
Analytical HPLC co-injections of a mixture of non-radioactive 9a and 9b with [18F]9a and [18F]9b. The retention time of [18F]9b differs slightly that of the non-radioactive form in this figures as these chromatograms were obtained from separate HPLC coinjections with only one non-radioactive chromatogram shown for simplicity. For both [18F]9a and [18F]9b, only one enantiomer was detectable.
Figure 4
Figure 4
Figure 4a. In vitro uptake of [18F]9a by DBT glioma cells in the presence and absence of amino-acid transport inhibitors. The uptake data are normalized based on the amount of activity added to each well and the total amount of protein in each well. The data are expressed as percentage uptake relative to the sodium control condition, and the values for each condition are noted in the appropriate bars. To provide a consistent osmolarity compared to the inhibitory conditions, Na control and Cho controls contain 10 mM of sucrose. Na = assay buffer containing sodium ions; Cho = assay buffer containing choline ions; MeAIB = 10 mM N-methyl α-aminoisobutryic acid (system A inhibitor); BCH = 10 mM 2-aminobicyclo(2,2,1)-heptane-2-carboxylic acid (system L inhibitor). Figure 4b. In vitro uptake of [18F]9b by DBT glioma cells in the presence and absence of amino-acid transport inhibitors. The uptake data are normalized based on the amount of activity added to each well and the total amount of protein in each well. The data are expressed as percentage uptake relative to the sodium control condition, and the values for each condition are noted in the appropriate bars. To provide a consistent osmolarity compared to the inhibitory conditions, Na control and Cho controls contain 10 mM of sucrose. Na = assay buffer containing sodium ions; Cho = assay buffer containing choline ions; MeAIB = 10 mM N-methyl α-aminoisobutryic acid (system A inhibitor); BCH = 10 mM 2-aminobicyclo(2,2,1)-heptane-2-carboxylic acid (system L inhibitor).
Figure 4
Figure 4
Figure 4a. In vitro uptake of [18F]9a by DBT glioma cells in the presence and absence of amino-acid transport inhibitors. The uptake data are normalized based on the amount of activity added to each well and the total amount of protein in each well. The data are expressed as percentage uptake relative to the sodium control condition, and the values for each condition are noted in the appropriate bars. To provide a consistent osmolarity compared to the inhibitory conditions, Na control and Cho controls contain 10 mM of sucrose. Na = assay buffer containing sodium ions; Cho = assay buffer containing choline ions; MeAIB = 10 mM N-methyl α-aminoisobutryic acid (system A inhibitor); BCH = 10 mM 2-aminobicyclo(2,2,1)-heptane-2-carboxylic acid (system L inhibitor). Figure 4b. In vitro uptake of [18F]9b by DBT glioma cells in the presence and absence of amino-acid transport inhibitors. The uptake data are normalized based on the amount of activity added to each well and the total amount of protein in each well. The data are expressed as percentage uptake relative to the sodium control condition, and the values for each condition are noted in the appropriate bars. To provide a consistent osmolarity compared to the inhibitory conditions, Na control and Cho controls contain 10 mM of sucrose. Na = assay buffer containing sodium ions; Cho = assay buffer containing choline ions; MeAIB = 10 mM N-methyl α-aminoisobutryic acid (system A inhibitor); BCH = 10 mM 2-aminobicyclo(2,2,1)-heptane-2-carboxylic acid (system L inhibitor).
Figure 5
Figure 5
Time-activity curves from intracranial DBT tumors and contralateral normal brain obtained with microPET after the injection of [18F]9a and [18F]9b. Mice were anesthetized with 1% isoflurane/oxygen and 200–300 μCi (7.4 – 11 MBq) of [18F]9a or [18F]9b was administered via tail vein injection at day 14 after tumor implantation. The data are displayed as average SUVs, and each time point represents the mean of 3 animals with standard deviation. Dynamic scanning time is 0–60 min.
Figure 6
Figure 6
Average tumor-to-brain ratios observed in microPET studies with [18F]9a and [18F]9b. The data were obtained in 3 mice with intracranial DBT tumors. Mice were anesthetized with 1% isoflurane/oxygen and 200–300 μCi (7.4 – 11 MBq) of [18F]9a or [18F]9b was administered via tail vein injection at day 14 after tumor implantation using INVEON and MicroPET Focus 220 systems. Dynamic scanning time is 0–60 min.
Figure 7
Figure 7
Representative microPET images obtained with [18F]9a and [18F]9b. Images A (PET/CT) and B (PET only) were acquired using [18F]9a, and images C (PET/CT) and D (PET only) were acquired with [18F]9b. The location of the tumor is designated on panels A and C with white arrows. Mice were anesthetized with 1% isoflurane/oxygen, and 200–300 μCi (7.4 – 11 MBq) of [18F]9a or [18F]9b was administered via tail vein injection approximately 2 weeks after tumor implantation. Images were acquired using INVEON and MicroPET Focus 220 systems. Dynamic scanning was performed for 0–60 min, and the displayed images are from summed data at 45–60 min after injection.

References

    1. Langen KJ, Pauleit D, Coenen HH. 3-[123I]Iodo-alpha-methyl-L-tyrosine: uptake mechanisms and clinical applications. Nucl Med Biol. 2002;29:625–31. - PubMed
    1. Langen KJ, Hamacher K, Weckesser M, Floeth F, Stoffels G, Bauer D, et al. O-(2-[18F]fluoroethyl)-L-tyrosine: uptake mechanisms and clinical applications. Nucl Med Biol. 2006;33:287–94. - PubMed
    1. Sutinen E, Jyrkkio S, Alanen K, Nagren K, Minn H. Uptake of [N-methyl-11C]alpha-methylaminoisobutyric acid in untreated head and neck cancer studied by PET. Eur J Nucl Med Mol Imaging. 2003;30:72–7. - PubMed
    1. McConathy J, Yu W, Jarkas N, Seo W, Schuster DM, Goodman MM. Radiohalogenated nonnatural amino acids as PET and SPECT tumor imaging agents. Med Res Rev. 2011;26:20250. - PubMed
    1. Qu W, Zha Z, Ploessl K, Lieberman BP, Zhu L, Wise DR, et al. Synthesis of optically pure 4-fluoro-glutamines as potential metabolic imaging agents for tumors. J Am Chem Soc. 2011;133:1122–33. - PubMed

Publication types