

Altered gene expression in the dorsolateral prefrontal cortex of individuals with schizophrenia
- PMID: 23528911
- PMCID: PMC3965839
- DOI: 10.1038/mp.2013.30
Altered gene expression in the dorsolateral prefrontal cortex of individuals with schizophrenia
Abstract
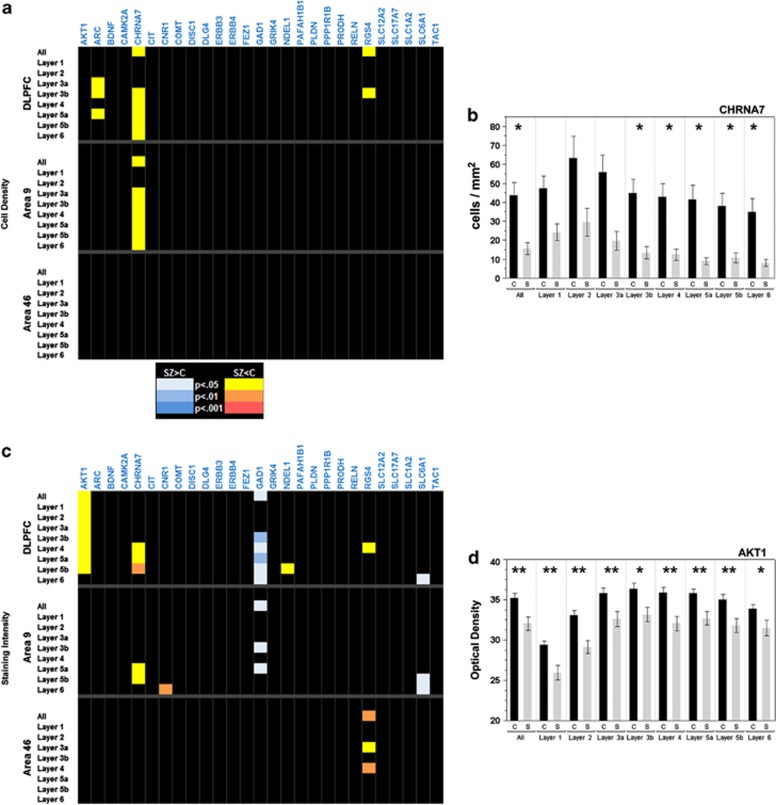
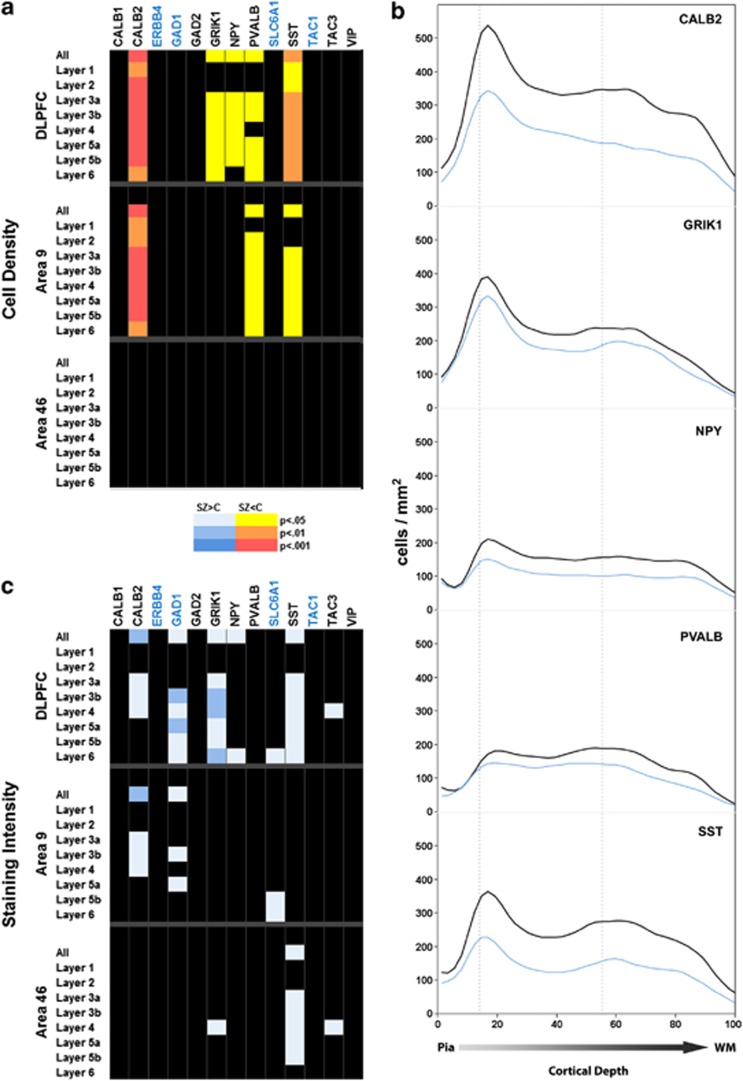
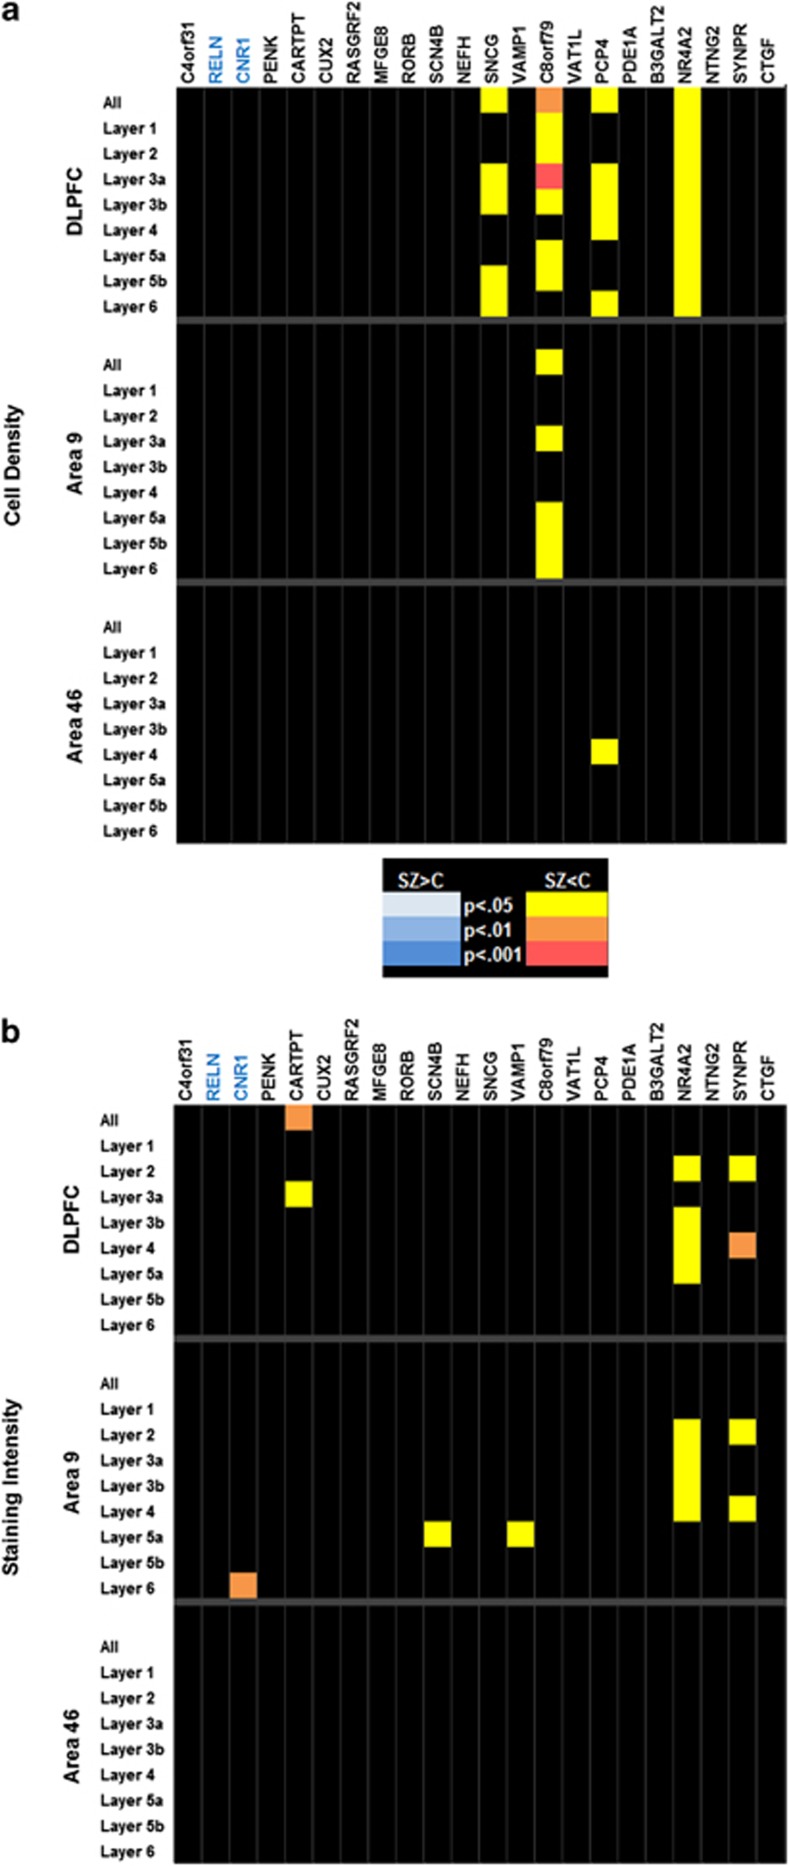
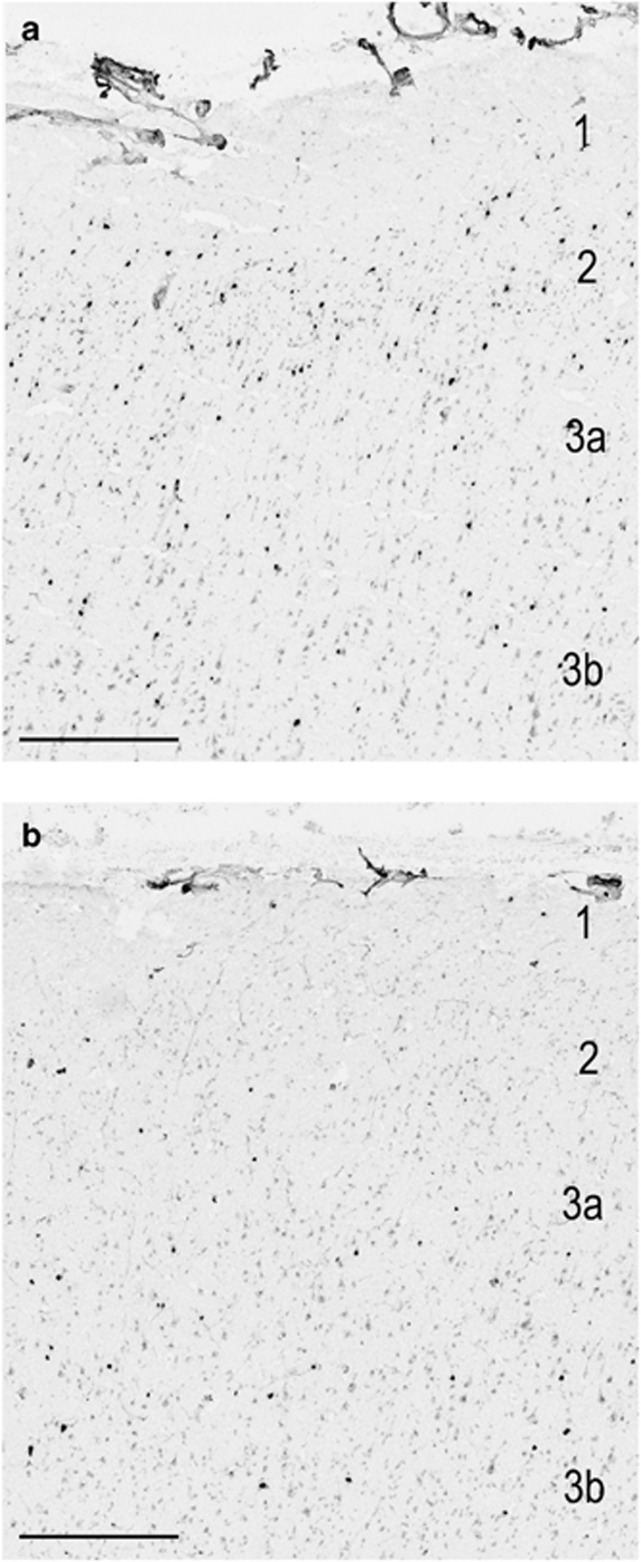
The underlying pathology of schizophrenia (SZ) is likely as heterogeneous as its symptomatology. A variety of cortical and subcortical regions, including the prefrontal cortex, have been implicated in its pathology, and a number of genes have been identified as risk factors for disease development. We used in situ hybridization (ISH) to examine the expression of 58 genes in the dorsolateral prefrontal cortex (DLPFC, comprised of Brodmann areas 9 and 46) from 19 individuals with a premorbid diagnosis of SZ and 33 control individuals. Genes were selected based on: (1) previous identification as risk factors for SZ; (2) cell type markers or (3) laminar markers. Cell density and staining intensity were compared in the DLPFC, as well as separately in Brodmann areas 9 and 46. The expression patterns of a variety of genes, many of which are associated with the GABAergic system, were altered in SZ when compared with controls. Additional genes, including C8orf79 and NR4A2, showed alterations in cell density or staining intensity between the groups, highlighting the need for additional studies. Alterations were, with only a few exceptions, limited to Brodmann area 9, suggesting regional specificity of pathology in the DLPFC. Our results agree with previous studies on the GABAergic involvement in SZ, and suggest that areas 9 and 46 may be differentially affected in the disease. This study also highlights additional genes that may be altered in SZ, and indicates that these potentially interesting genes can be identified by ISH and high-throughput image analysis techniques.
Figures
References
-
- American Psychiatric Association, American Psychiatric Association. Task Force on DSM-IV Diagnostic and Statistical Manual of Mental Disorders: DSM-IV4th edn.American Psychiatric Association: Washington, DC; 886.1994. xxvii.
-
- Henry JD, Rendell PG, Kliegel M, Altgassen M. Prospective memory in schizophrenia: primary or secondary impairment. Schizophr Res. 2007;95:179–185. - PubMed
-
- Nestor PG, Niznikiewicz M, McCarley RW. Distinct contribution of working memory and social comprehension failures in neuropsychological impairment in schizophrenia. J Nerv Ment Dis. 2010;198:206–212. - PubMed
-
- Schwartz BL, Rosse RB, Deutsch SI. Toward a neuropsychology of memory in schizophrenia. Psychopharmacol Bull. 1992;28:341–351. - PubMed
MeSH terms
Substances
LinkOut - more resources
Full Text Sources
Other Literature Sources
Medical
