. 2013 May;182(5):1648-58.
doi: 10.1016/j.ajpath.2013.01.047. Epub 2013 Mar 23.

Role and regulation of PDGFRα signaling in liver development and regeneration

Affiliations

Role and regulation of PDGFRα signaling in liver development and regeneration

Prince K Awuah et al. Am J Pathol. 2013 May.

Abstract

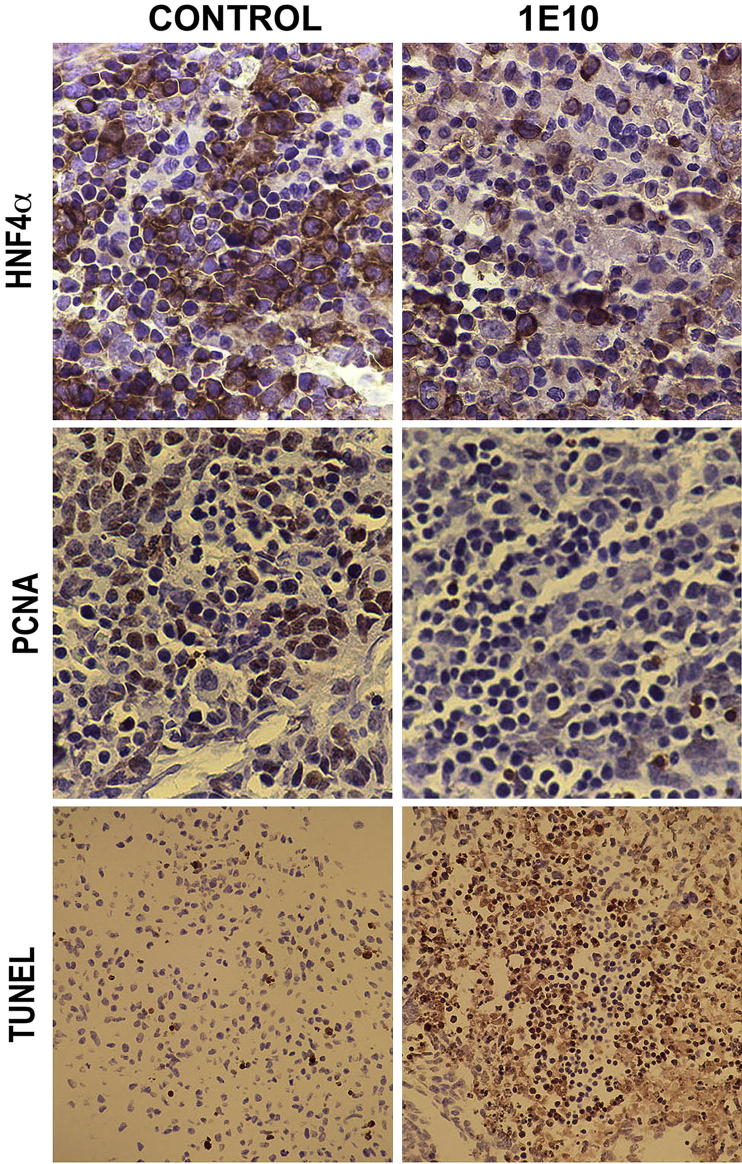
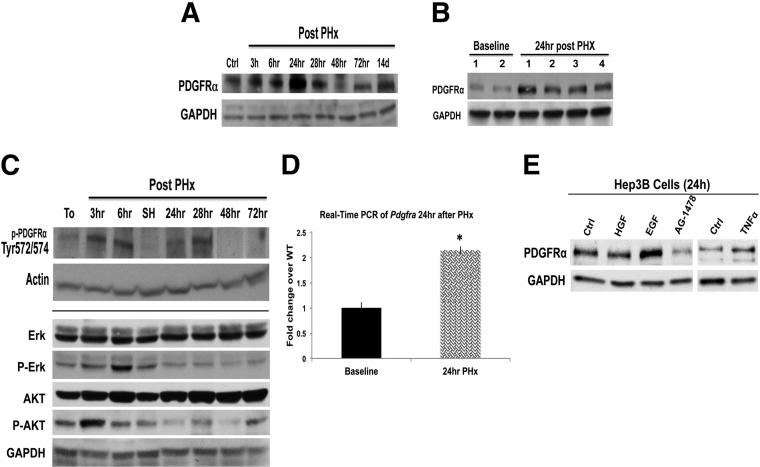
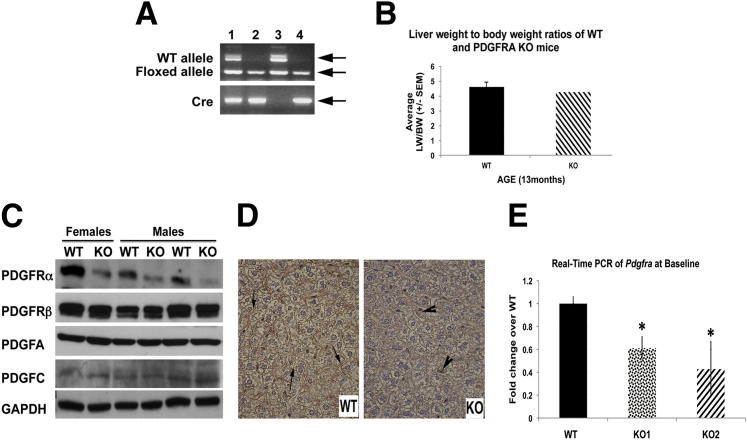
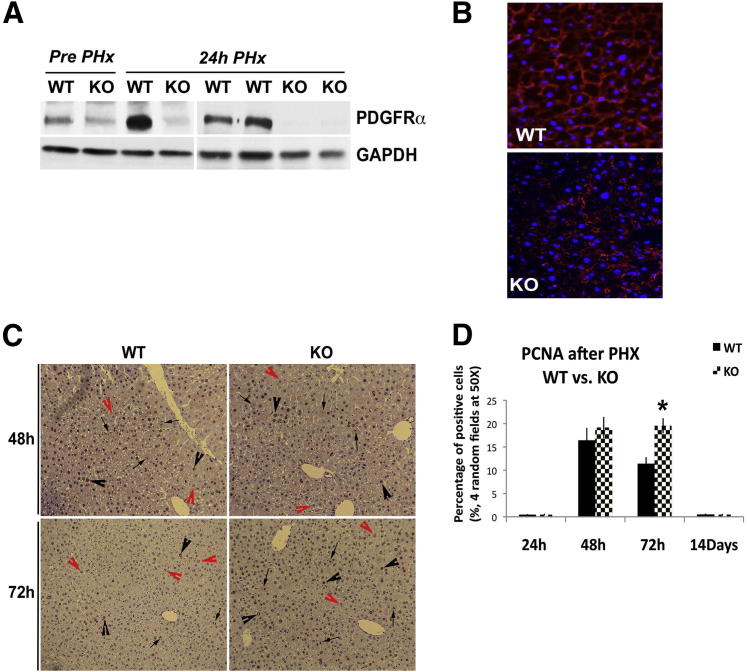
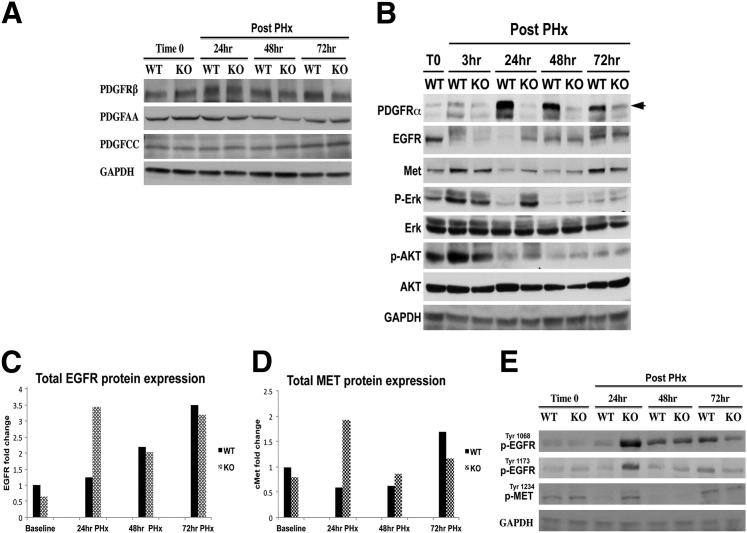
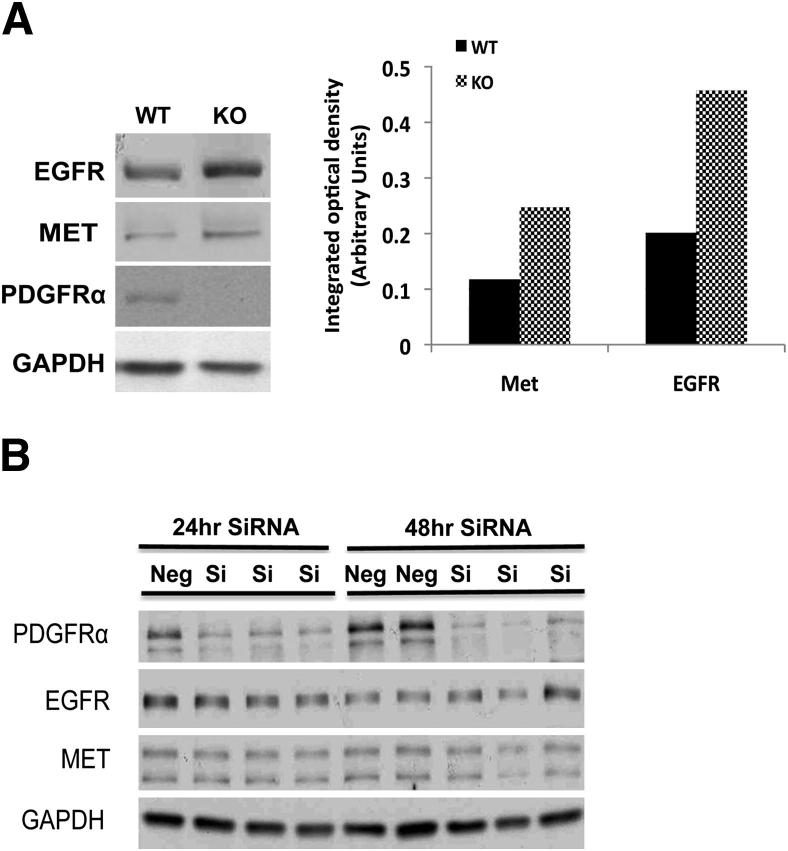
Aberrant platelet-derived growth factor receptor-α (PDGFRα) signaling is evident in a subset of hepatocellular cancers (HCCs). However, its role and regulation in hepatic physiology remains elusive. In the current study, we examined PDGFRα signaling in liver development and regeneration. We identified notable PDGFRα activation in hepatic morphogenesis that, when interrupted by PDGFRα-blocking antibody, led to decreased hepatoblast proliferation and survival in embryonic liver cultures. We also identified temporal PDGFRα overexpression, which is regulated by epidermal growth factor (EGF) and tumor necrosis factor α, and its activation at 3 to 24 hours after partial hepatectomy. Through generation of hepatocyte-specific PDGFRA knockout (KO) mice that lack an overt phenotype, we show that absent PDGFRα compromises extracelluar signal-regulated kinases and AKT activation 3 hours after partial hepatectomy, which, however, is alleviated by temporal compensatory increases in the EGF receptor (EGFR) and the hepatocyte growth factor receptor (Met) expression and activation along with rebound activation of extracellular signal-regulated kinases and AKT at 24 hours. These untimely increases in EGFR and Met allow for normal hepatocyte proliferation at 48 hours in KO, which, however, are aberrantly prolonged up to 72 hours. Intriguingly, such compensation also was visible in primary KO hepatocyte cultures but not in HCC cells after siRNA-mediated PDGFRα knockdown. Thus, temporal activation of PDGFRα in liver development is important in hepatic morphogenesis. In liver regeneration, despite increased signaling, PDGFRα is dispensable owing to EGFR and Met compensation, which is unique to normal hepatocytes but not HCC cells.


Figures

Figure 1
Figure 1
PDGFRα expression and activation in early liver development. A: A representative WB shows the highest expression of PDGFRα at E11 in liver lysates with a gradual decrease over the following days of gestational development in mice. B: Left panel: A representative double immunofluorescence with PDGFRα (red) expressed in HNF4α-positive hepatoblasts (green) cells in E12.5 murine liver (arrowheads). Right panel: PDGFRβ (red) expressed in non–HNF4α-positive cells (arrows), whereas HNF4α-positive (green) hepatoblasts (arrowheads) are negative for PDGFRβ. Original magnification: ×400. C: WB verifies PDGFRα expression in the HBC3 hepatoblast cell line and E11 liver whole-cell lysate. D: WB shows high PDGF-CC, but not PDGF-AA, during early liver development, whereas PDGF-AA levels increase at later stages. E: WB shows PDGFRα phosphorylation at multiple sites, indicating its activation in embryonic livers at early stages of hepatic development. F: WB shows tyrosine phosphorylation of phosphatidylinositide 3-kinase (PI3K)-p85 and AKT, depicting activation at corresponding early stages of hepatic development. Ad, adult; D1, postnatal day 1; GAPDH, glyceraldehyde-3-phosphate dehydrogenase.
Figure 2
Figure 2
PDGFRα blockade in embryonic liver cultures shows its role in hepatoblast proliferation and survival. Embryonic livers cultured in PDGFRα-blocking 1E10-IMC monoclonal antibody show decreased numbers of HNF4α-positive cells by IHC. In addition, there was a notable decrease in PCNA-positive cells and increase in numbers of TUNEL-positive cells after 1E10-IMC treatment compared to cells grown in 4% serum and shown in representative photomicrographs. Original magnification: HNF4α and PCNA, ×400; TUNEL, ×200.
Figure 3
Figure 3
Temporal increase in PDGFRα expression and activation during LR after PHx. A: Representative WB from pooled livers showed increased PDGFRα protein expression after PHx, with peak expression evident at 24 hours after PHx. GAPDH verifies comparable loading. B: WB using whole-cell lysates from 4 individual animals showed a notable increase in total PDGFRα at 24 hours after PHx as compared with normal livers at baseline, whereas GAPDH showed comparable loading. C: Representative WB shows activation of PDGFRα (phosphorylated at Tyr 572 and 574), ERK (phosphorylated at Thr202 and Tyr204 of ERK1 or Thr185 and Tyr187 of ERK2), and AKT (phosphorylated at Thr308) at various time points after PHx using a site-specific PDGFRα. SH, sham surgery sample. D: Real-time PCR showing a twofold increase in Pdgfra 24 hours after PHx (P = 0.0001). Lysates from Hep3B cells that were treated with various growth factors for 24 hours show increased PDGFRα expression in response to EGF and TNFα treatment. E: The increase by EGF was abrogated by concomitant use of EGFR inhibitor AG-1478. GAPDH depicts equal loading. Ctrl, control; GAPDH, glyceraldehyde-3-phosphate dehydrogenase. P < 0.05.
Figure 4
Figure 4
Generation of PDGFRα KO mice reveal a lack of overt phenotype. A: Genotyping PCR identifies KOs (lanes 2 and 4) by the presence of cre recombinase (lower panel) and floxed PDGFRα allele (242 bp) (upper panel). WT controls were identified by the absence of cre (lane 3) or the presence of cre in animals that harbor the WT PDGFRα allele (451 bp) and floxed allele (lane 1). The arrows point to the correct bands of expected sizes and represent various alleles as noted on the left side of the panel (WT allele, floxed allele, and Cre). B: Graph depicting insignificant change in liver weight to body weight (LW/BW) ratios between WT (n = 6) and KO (n = 5) mice at baseline. C: WB shows a significant decrease in total PDGFRα protein in the KO livers. No changes in the levels of PDGFRβ and PDGFRα ligands including PDGF-AA and PDGF-CC were observed. D: IHC of WT (left) livers show expression of PDGFRα at the hepatocyte membrane (arrows). PDGFRα KO livers (right) show reduced PDGFRα staining, which was localized to nonparenchymal cells (arrowheads). Original magnification: ×400. E: Real-time PCR showing a significant decrease in Pdgfra expression in KO livers (P = 0.0001). ∗P < 0.05.
Figure 5
Figure 5
Continued proliferation in PDGFRα KO during LR after PHx. A: Representative WB verifies abrogation of the surge in PDGFRα expression in KO livers at 24 hours after PHx as compared with WT. B: Immunofluorescence shows PDGFRα (red) localizing to the hepatocyte membrane at 24 hours after PHx in WT liver, whereas it is localized to nonparenchymal cells and is conspicuously absent from hepatocyte membranes in KO. Original magnification: ×400. C: PCNA IHC in WT liver and KO liver at 48 and 72 hours after PHx shows enhanced nuclear staining (black arrowheads) and mitosis (arrows) in KO, especially at 72 hours. PCNA-negative hepatocytes are indicated by red arrowheads. Original magnification: ×100. D: Bar graph of PCNA index of WT and KO livers shows comparable cells in the S-phase at 48 hours whereas a significant increase is observed in KO at 72 hours. P < 0.05. GAPDH, glyceraldehyde-3-phosphate dehydrogenase.
Figure 6
Figure 6
Loss of hepatocyte Pdgfra induces a temporal increase in EGFR and Met expression and activation at 24 hours after PHx. A: Representative WB from pooled livers showed no changes in protein expression of PDGFRβ, PDGF-AA, or PDGF-BB at various time points after PHx in KO when compared with WT. B: Representative WB shows decreased p-AKT and p-ERK in KO compared with WT at 3 hours during LR. Enhanced EGFR and MET protein expression in KO livers at 24 hours after PHx coincides with increased p-AKT and p-ERK at this time in KO compared with WT. C: Quantification of changes in EGFR protein after PHx shows a 2.5-fold increase in KO livers at 24 hours after PHx, normalized to baseline WT. D: Quantification of changes in MET protein levels after PHx shows a twofold increase over baseline, normalized to baseline WT. E: Representative WB shows enhanced protein expression of phosphorylated forms of EGFR and MET as indicated, especially at 24 hours after PHx. GAPDH, glyceraldehyde-3-phosphate dehydrogenase.
Figure 7
Figure 7
EGFR and Met expression is induced after PDGFRα loss in normal hepatocytes but not in HCC cells. A: Primary hepatocytes isolated from age- and sex-matched WT and KO livers in culture for 24 hours show increased expression of EGFR and Met in KO. Densitometric analysis on the representative WB shows at least a 2.0-fold increase in Met and a 2.5-fold increase in EGFR levels in the KO hepatocytes. B: A representative WB shows that PDGFRα siRNA but not control-siRNA transfection of Hep3B cells leads to a notable decrease in PDGFRα expression, at both 24 hours and 48 hours. No changes in EGFR or Met were detectable at either time point. GAPDH, glyceraldehyde-3-phosphate dehydrogenase; Si, silencing.

References

    1. Andrae J., Gallini R., Betsholtz C. Role of platelet-derived growth factors in physiology and medicine. Genes Dev. 2008;22:1276–1312. - PMC - PubMed
    1. Claesson-Welsh L. Platelet-derived growth factor receptor signals. J Biol Chem. 1994;269:32023–32026. - PubMed
    1. Hoch R.V., Soriano P. Roles of PDGF in animal development. Development. 2003;130:4769–4784. - PubMed
    1. Heldin C.H., Ostman A., Ronnstrand L. Signal transduction via platelet-derived growth factor receptors. Biochim Biophys Acta. 1998;1378:F79–F113. - PubMed
    1. Franke T.F., Yang S.I., Chan T.O., Datta K., Kazlauskas A., Morrison D.K., Kaplan D.R., Tsichlis P.N. The protein kinase encoded by the Akt proto-oncogene is a target of the PDGF-activated phosphatidylinositol 3-kinase. Cell. 1995;81:727–736. - PubMed

Publication types

MeSH terms

Substances