

Carotid body denervation prevents the development of insulin resistance and hypertension induced by hypercaloric diets
- PMID: 23530003
- PMCID: PMC3717872
- DOI: 10.2337/db12-1463
Carotid body denervation prevents the development of insulin resistance and hypertension induced by hypercaloric diets
Abstract
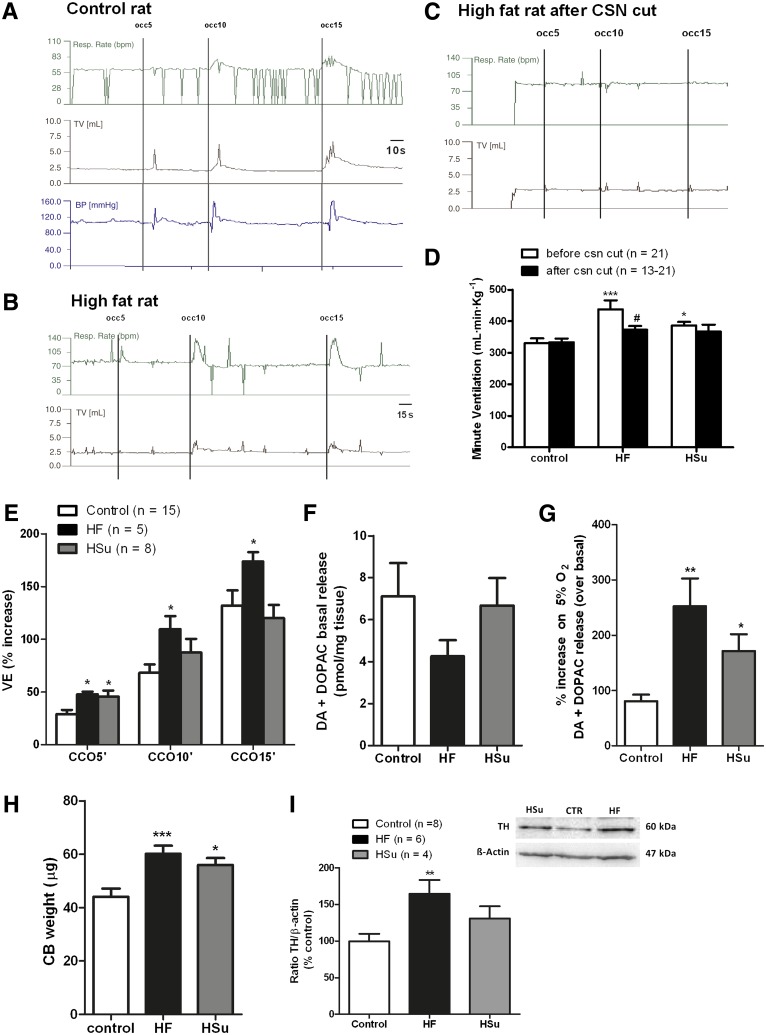
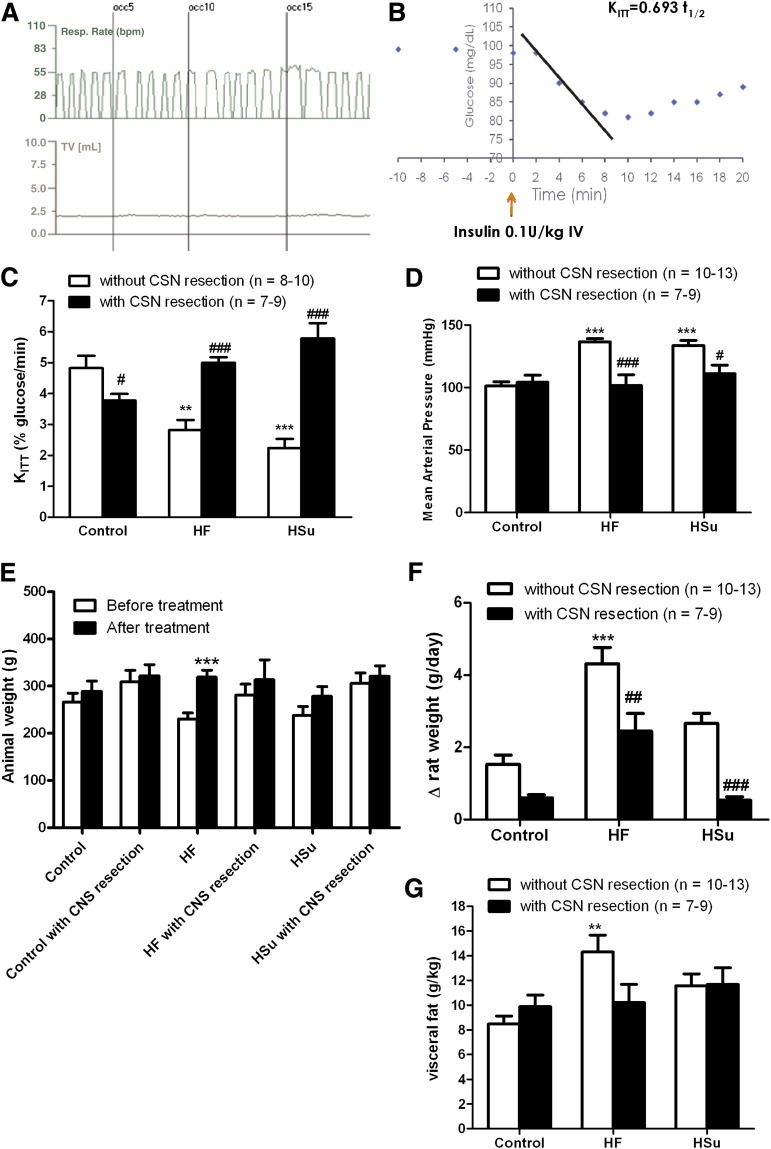
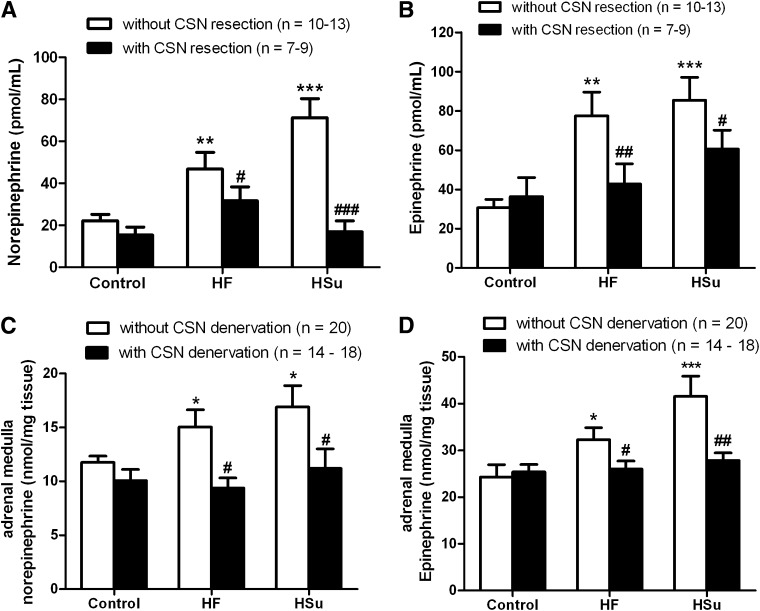
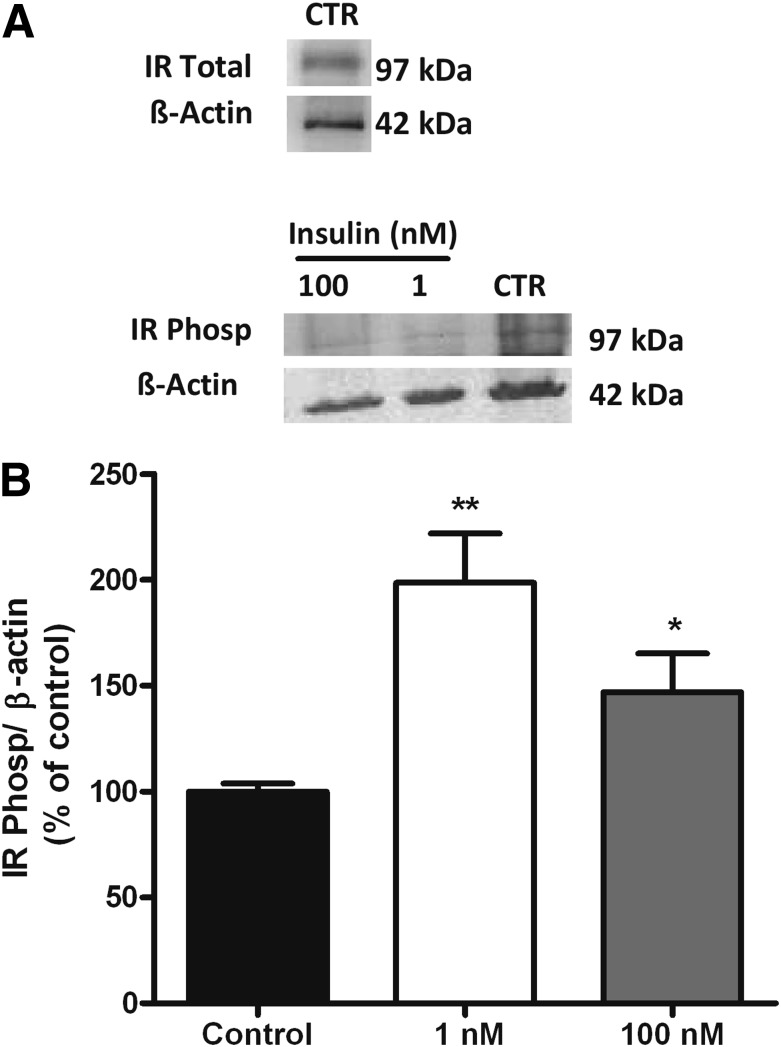
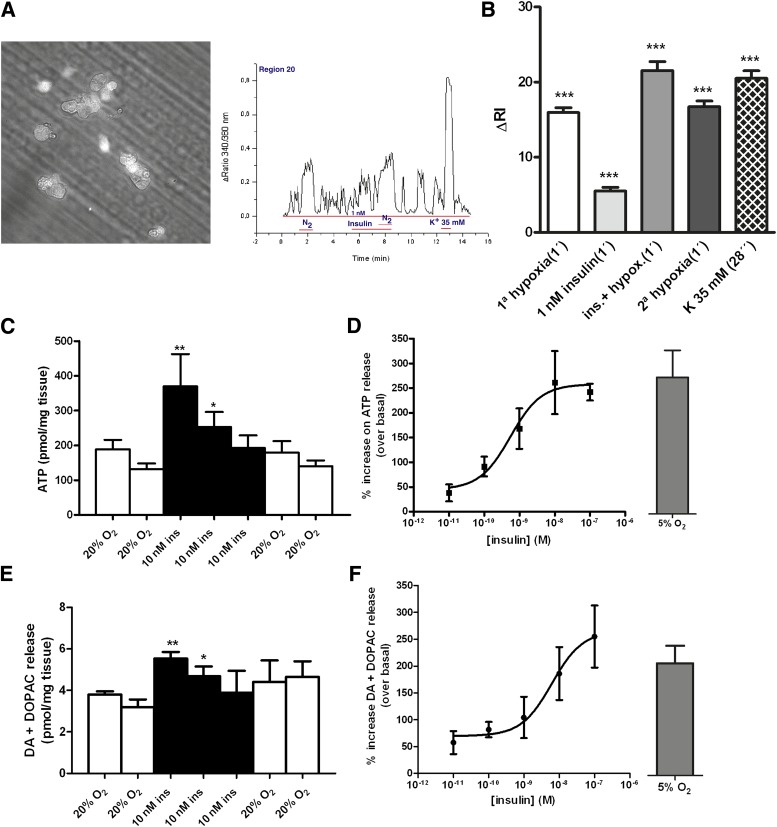
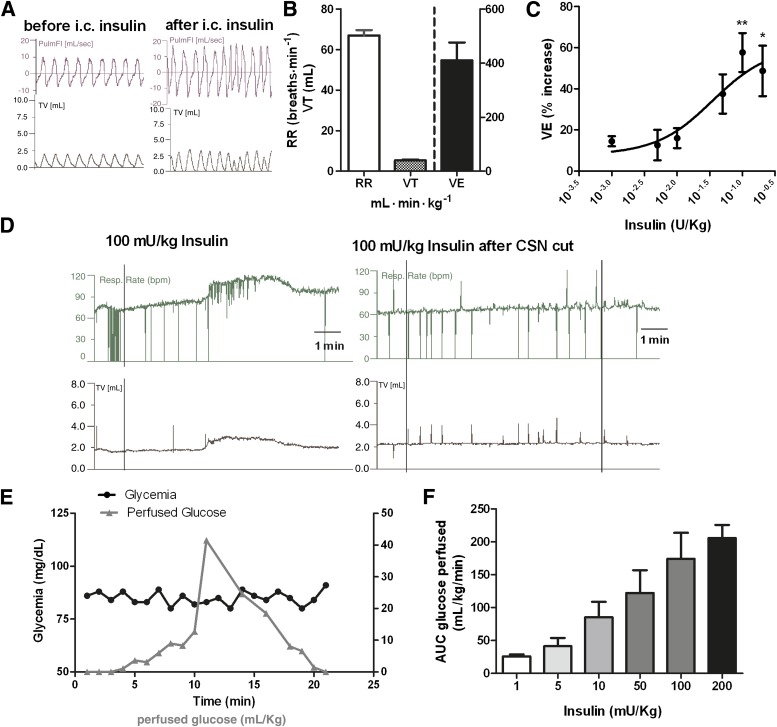
Increased sympathetic activity is a well-known pathophysiological mechanism in insulin resistance (IR) and hypertension (HT). The carotid bodies (CB) are peripheral chemoreceptors that classically respond to hypoxia by increasing chemosensory activity in the carotid sinus nerve (CSN), causing hyperventilation and activation of the sympathoadrenal system. Besides its role in the control of ventilation, the CB has been proposed as a glucose sensor implicated in the control of energy homeostasis. However, to date no studies have anticipated its role in the development of IR. Herein, we propose that CB overstimulation is involved in the etiology of IR and HT, core metabolic and hemodynamic disturbances of highly prevalent diseases like the metabolic syndrome, type 2 diabetes, and obstructive sleep apnoea. We demonstrate that CB activity is increased in IR animal models and that CSN resection prevents CB overactivation and diet-induced IR and HT. Moreover, we show that insulin triggers CB, highlighting a new role for hyperinsulinemia as a stimulus for CB overactivation. We propose that CB is implicated in the pathogenesis of metabolic and hemodynamic disturbances through sympathoadrenal overactivation and may represent a novel therapeutic target in these diseases.
Figures
Comment in
-
Insulin and sympathoexcitation: it is not all in your head.Diabetes. 2013 Aug;62(8):2654-5. doi: 10.2337/db13-0613. Diabetes. 2013. PMID: 23881194 Free PMC article. No abstract available.
Similar articles
-
Carotid body, insulin, and metabolic diseases: unraveling the links.Front Physiol. 2014 Oct 29;5:418. doi: 10.3389/fphys.2014.00418. eCollection 2014. Front Physiol. 2014. PMID: 25400585 Free PMC article. Review.
-
High fat diet blunts the effects of leptin on ventilation and on carotid body activity.J Physiol. 2018 Aug;596(15):3187-3199. doi: 10.1113/JP275362. Epub 2018 Jan 15. J Physiol. 2018. PMID: 29271068 Free PMC article.
-
Functional abolition of carotid body activity restores insulin action and glucose homeostasis in rats: key roles for visceral adipose tissue and the liver.Diabetologia. 2017 Jan;60(1):158-168. doi: 10.1007/s00125-016-4133-y. Epub 2016 Oct 16. Diabetologia. 2017. PMID: 27744526
-
Long-Term Hypercaloric Diet Consumption Exacerbates Age-Induced Dysmetabolism and Carotid Body Dysfunction: Beneficial Effects of CSN Denervation.Front Physiol. 2022 May 4;13:889660. doi: 10.3389/fphys.2022.889660. eCollection 2022. Front Physiol. 2022. PMID: 35600301 Free PMC article.
-
Exploring the Mediators that Promote Carotid Body Dysfunction in Type 2 Diabetes and Obesity Related Syndromes.Int J Mol Sci. 2020 Aug 3;21(15):5545. doi: 10.3390/ijms21155545. Int J Mol Sci. 2020. PMID: 32756352 Free PMC article. Review.
Cited by
-
Fat feeding facilitates hot bodies, but is resistance futile?J Physiol. 2018 Aug;596(15):2953-2954. doi: 10.1113/JP275716. Epub 2018 Feb 21. J Physiol. 2018. PMID: 29380365 Free PMC article. No abstract available.
-
Gender Differences in the Context of Obstructive Sleep Apnea and Metabolic Diseases.Front Physiol. 2021 Dec 14;12:792633. doi: 10.3389/fphys.2021.792633. eCollection 2021. Front Physiol. 2021. PMID: 34970158 Free PMC article.
-
A 2 Adenosine Receptors Mediate Whole-Body Insulin Sensitivity in a Prediabetes Animal Model: Primary Effects on Skeletal Muscle.Front Endocrinol (Lausanne). 2020 Apr 28;11:262. doi: 10.3389/fendo.2020.00262. eCollection 2020. Front Endocrinol (Lausanne). 2020. PMID: 32411098 Free PMC article.
-
Neurotransmitter Modulation of Carotid Body Germinal Niche.Int J Mol Sci. 2020 Nov 3;21(21):8231. doi: 10.3390/ijms21218231. Int J Mol Sci. 2020. PMID: 33153142 Free PMC article. Review.
-
Joint Association of Remnant Cholesterol and Body Mass Index with Hypertension: A National Cohort Study in Chinese Adults.J Multidiscip Healthc. 2025 Mar 30;18:1813-1825. doi: 10.2147/JMDH.S516335. eCollection 2025. J Multidiscip Healthc. 2025. PMID: 40182616 Free PMC article.
References
-
- Katagiri H, Yamada T, Oka Y. Adiposity and cardiovascular disorders: disturbance of the regulatory system consisting of humoral and neuronal signals. Circ Res 2007;101:27–39 - PubMed
-
- Dunaif A, Segal KR, Futterweit W, Dobrjansky A. Profound peripheral insulin resistance, independent of obesity, in polycystic ovary syndrome. Diabetes 1989;38:1165–1174 - PubMed
-
- Peppard PE, Young T, Palta M, Skatrud J. Prospective study of the association between sleep-disordered breathing and hypertension. N Engl J Med 2000;342:1378–1384 - PubMed
-
- Iturriaga R, Rey S, Del Río R. Cardiovascular and ventilatory acclimatization induced by chronic intermittent hypoxia: a role for the carotid body in the pathophysiology of sleep apnea. Biol Res 2005;38:335–340 - PubMed
Publication types
MeSH terms
Substances
LinkOut - more resources
Full Text Sources
Other Literature Sources
Medical
