. 2013 Jun;33(11):2302-14.
doi: 10.1128/MCB.00189-13. Epub 2013 Mar 25.

MCJ/DnaJC15, an endogenous mitochondrial repressor of the respiratory chain that controls metabolic alterations

Affiliations

MCJ/DnaJC15, an endogenous mitochondrial repressor of the respiratory chain that controls metabolic alterations

Ketki M Hatle et al. Mol Cell Biol. 2013 Jun.

Abstract

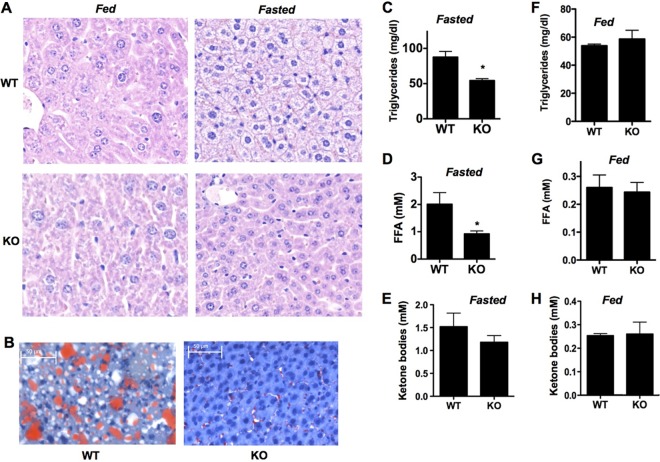
Mitochondria are the main engine that generates ATP through oxidative phosphorylation within the respiratory chain. Mitochondrial respiration is regulated according to the metabolic needs of cells and can be modulated in response to metabolic changes. Little is known about the mechanisms that regulate this process. Here, we identify MCJ/DnaJC15 as a distinct cochaperone that localizes at the mitochondrial inner membrane, where it interacts preferentially with complex I of the electron transfer chain. We show that MCJ impairs the formation of supercomplexes and functions as a negative regulator of the respiratory chain. The loss of MCJ leads to increased complex I activity, mitochondrial membrane potential, and ATP production. Although MCJ is dispensable for mitochondrial function under normal physiological conditions, MCJ deficiency affects the pathophysiology resulting from metabolic alterations. Thus, enhanced mitochondrial respiration in the absence of MCJ prevents the pathological accumulation of lipids in the liver in response to both fasting and a high-cholesterol diet. Impaired expression or loss of MCJ expression may therefore result in a "rapid" metabolism that mitigates the consequences of metabolic disorders.


Figures

Fig 1
Fig 1
Specific tissue distribution of mouse and human MCJ/DnaJC15. (A) Alignment of protein sequences of human MCJ/DnaJC15 (hMCJ) and its ortholog in the mouse (mMCJ) and differences in amino acids (red). (B) Northern blot analysis of mouse normal tissue poly(A) mRNA using a specific mouse mcj probe. (C) Northern blot analysis of human normal tissue poly(A) mRNA using a specific human mcj probe. (D) Real-time RT-PCR for mcj using RNA from mouse B cells, CD4 T cells, and CD8 T cells. mRNA levels were normalized to β2 microglobulin. The error bars indicate standard deviations. (E) Whole-cell extracts from 293T cells transfected with a mouse mcj-expressing plasmid (mMCJ) or an empty plasmid (Cont.) were examined for mouse MCJ expression (MCJ) by Western blotting. Actin was examined as a loading control. (F) Endogenous MCJ protein expression in mouse liver, heart, kidney, and lung was examined by Western blotting. Actin expression was examined as a loading control. (G) Endogenous MCJ protein expression in mouse CD4 T cells and CD8 T cells was examined by Western blotting.
Fig 2
Fig 2
Endogenous MCJ localizes to the mitochondria. (A and B) Immunoelectron microscopy analysis of endogenous MCJ in heart (A) and purified CD8 T cells (B) from wild-type mice. Electron-dense gold particles represent MCJ (the arrows point to representative immunoreactivities). Higher magnifications of the boxed areas are shown on the right. m, mitochondria; mf, myofibrils. Magnification, ×20,000. Bars, 200 nm. (C) MCJ expression in purified cytosolic (Cyt) and mitochondrial (Mito) extracts from mouse heart by Western blotting. GAPDH was used as a marker for the cytosolic fraction, and CoxIV was used as a marker for the mitochondrial fraction. (D) Syntaxin 11 (Syn11) and calreticulin (Calret) expression in purified cytosolic and mitochondrial extracts, as well as whole-cell extracts (WE) from mouse heart. (E and F) MCJ expression in purified cytosolic and mitochondrial extracts from mouse CD8 T cells (E) and human MCF7 cells (F) was examined by Western blotting. (G) MCJ expression in purified whole mitochondrial extracts (Mito) and mitochondrial inner membrane fraction extracts (MIM) from mouse heart. CoxIV and Bcl-xL were used as markers for the mitochondrial inner and outer membrane, respectively.
Fig 3
Fig 3
MCJ depolarizes mitochondria and decreases ATP levels. (A) Intracellular ATP levels in MCF7 cells and MCF7/siMCJ cells (104 cells) incubated in medium. The error bars indicate standard deviations. (B) Cell recovery of MCF7/siMCJ cell cultures after incubation in medium alone (Med) or rotenone (Roten) (10 μM) for 7 h; 5 × 10⁵ cells were plated the day before the treatment. (C) Intracellular ATP levels in MCF7/siMCJ cells (104 cells) after incubation in medium or rotenone for 7 h. (D) MMP in freshly isolated wild-type (WT) CD8 T cells and WT CD4 T cells was determined by staining with TMRE and flow cytometry analysis. (E) mROS in freshly isolated WT CD8 T cells and WT CD4 T cells was determined by staining with MitoSox-Red and flow cytometry analysis. (F) Southern blot analysis showing MCJ-targeted (∼11-kb) and wild-type (∼16-kb) alleles in wild-type (+/+), heterozygous (+/−), and MCJ KO (−/−) mice. (G) Western blot analysis for MCJ in whole-cell extracts from liver, heart, and CD4 and CD8 T cells from WT and MCJ KO mice. Actin was analyzed as a loading control. (H) RT-PCR for MCJ using RNA from CD8 T cells isolated from WT, MCJ KO, and MCJ heterozygous mice. HPRT expression was examined as a control. (I) MMP in freshly isolated WT CD8 T cells and MCJ KO CD8 T cells was determined as in panel D. (J) mROS in freshly isolated WT CD8 T cells and MCJ KO CD8 T cells was determined as in panel F. (K) MMP in freshly isolated WT CD4 T cells and MCJ KO CD4 T cells. (L) mROS in freshly isolated WT CD4 T cells and MCJ KO CD4 T cells. *, P < 0.05. Statistical significance was determined by Student's t test. The data are representative of three independent experiments.
Fig 4
Fig 4
MCJ is a repressor of mitochondrial respiratory chain complex I activity. (A) The presence of MCJ, NDUFA9, and NDUFS3 in immunoprecipitates of complex I from mitochondrial extracts generated from WT and MCJ KO hearts was examined by Western blotting. (B) The presence of CoxIV, cytochrome c (Cyt c), and NDUFA9 in immunoprecipitates of complex I (i.p. Com I) and in the flowthrough extracts resulting from the immunoprecipitation (Flow Thr) using extracts from WT and MCJ KO hearts was examined by Western blotting. (C) The presence of MCJ and Core1 protein of complex III in immunoprecipitates of complex III (i.p. Com III) and flowthrough using mitochondrial extracts from WT and MCJ KO hearts was examined by Western blotting. (D) Relative complex I activities in mitochondrial extracts (10 μg) from WT and MCJ KO mouse hearts. The error bars indicate standard deviations. (E) Expression of NDUFA9 and MCJ in heart mitochondrial extracts from WT and MCJ KO mice was examined by Western blotting. (F) Expression of MCJ, NDUFA9, NDUFS3, and actin in mitochondrial extracts from WT CD4, WT CD8, and MCJ KO CD8 T cells was examined by Western blotting. (G) Relative complex I activity in mitochondrial extracts (5 μg) from freshly isolated WT CD4, WT CD8, and MCJ KO CD8 T cells. *, P < 0.05. Statistical significance was determined by the Student t test.
Fig 5
Fig 5
Loss of MCJ facilitates the formation of ETC supercomplexes. (A) BN gel electrophoresis of digitonin-solubilized mitochondrial extracts from wild-type heart. Monomeric complex I (CI), dimer complex III, monomeric complexes IV and V, and supercomplexes (SC) are marked. (B) Digitonin-solubilized mitochondrial extracts from mouse heart were resolved in 2D-BN/SDS-PAGE. Western blot analysis for MCJ, NDUFA9, complex III Core1 protein, and CoxIV was performed. (C) BN electrophoresis of digitonin-solubilized mitochondrial extracts from WT and MCJ KO mouse hearts. (Right) Magnification of the supercomplex (SC) area. Squares denote individual supercomplex bands. Below (a) is shown the densitometry of the supercomplex “a” area. OD, optical density. (D) Magnification of the supercomplex region from a different BN gel with mitochondrial extracts (digitonin) from an independent set of WT and MCJ KO mouse hearts. Below (a) is shown the densitometry of the supercomplex “a” area. (E) BN-PAGE of maltoside-solubilized mitochondrial extracts from WT and MCJ KO hearts. Monomeric complex I, dimer complex III, and monomeric complexes IV and V are marked. (F) BN-PAGE of digitonin-solubilized mitochondrial extracts from WT and MCJ KO hearts transferred into a membrane (Western blot) and immunoblotted for NDUFA9, CoxIV, and Core1 protein. Immunoreactivity for the three proteins within the supercomplex (SC) region is shown. Immunoreactivity for NDUFA9 with monomeric complex I (CI), Core1 with dimeric complex III (CIII), and CoxIV with monomeric complex IV (CIV) is shown.
Fig 6
Fig 6
MCJ is a negative regulator of complex I activity in supercomplexes. (A) In-gel NADH dehydrogenase activity in BN electrophoresis using digitonin-mitochondrial extracts from WT and MCJ KO mouse hearts. The purple bands represent those containing NADH dehydrogenase activity (complex I and supercomplexes). On the right is shown a magnification of the supercomplex area. Squares denote individual supercomplex bands. Below (a) is shown the densitometry of the supercomplex “a” area. (B) Western blot analysis for NDUFA9 in eluates from the supercomplex regions of BN gels using digitonin-solubilized mitochondrial extracts from WT and MCJ KO hearts. (C) (Top) Images from electron micrographs of MCJ-KO supercomplexes eluted from a blue native gel. Complexes I, III, and IV are indicated. Scale bar, 100 Å. (Bottom) Two projections calculated from the 3D structure of the bovine supercomplex (EMDataBank entry EMD-5319). (D) Relative complex I activities in eluates of supercomplex regions of BN gels using digitonin-solubilized mitochondrial extracts from WT and MCJ KO hearts. Each set represents independent mitochondrial preparations from individual mouse hearts (total, 3 WT and 3 KO mice) and independent BN-PAGE/elutions.
Fig 7
Fig 7
MCJ deficiency enhances liver lipid metabolism during fasting. (A) Liver histology by H&E staining from WT and MCJ KO mice under normal or fasted conditions. Magnification, ×200. (B) Sections from frozen livers of fasted wild-type and MCJ KO mice were stained with Oil Red O for detection of lipids. (C to E) Serum triglyceride levels (C), FFA (D), and ketone bodies (E) in fasted WT and MCJ KO mice (n = 4). (F to H) Serum triglyceride levels (F), FFA (G), and ketone bodies (H) in normally fed WT and MCJ KO mice (n = 3). *, P < 0.05. Statistical significance was determined by Student's t test. The error bars indicate standard deviations.
Fig 8
Fig 8
MCJ deficiency promotes glyconeogenesis during fasting. (A) Percentages of total body weight loss after 36 h of fasting relative to the initial weight in WT and MCJ KO mice (n = 3). (B) Total body weight in WT and MCJ KO mice prior to fasting. (C) Glucose levels in blood 12 h after fasting. (D) Glucose levels in blood prior to and during fasting. (E) ATP concentrations in liver extracts from WT and MCJ KO mice after fasting (36 h). (F) PAS staining in liver sections from WT and MCJ KO mice after fasting. (G) Glycogen contents in liver extracts from WT and MCJ KO mice (n = 3) after fasting (36 h) or normal feeding. (H) Percentages of liver weight versus total body weight in WT and MCJ KO mice after fasting (36 h) or normal feeding. (I) Western blot analysis for glycogen synthase (GS) and PEPCK in livers from WT and MCJ KO mice normally fed (Cont) or after fasting (Fast) for 36 h. Livers from two mice are shown for the fasting condition. (J) Cholesterol content in livers of WT and MCJ KO mice (n = 5) after 4 weeks on a high-cholesterol diet. (K) Cholesterol contents in livers of WT and MCJ KO mice (n = 4) fed a normal diet. *, P < 0.05. Statistical significance was determined by the Student t test. The error bars indicate standard deviations.

References

    1. Starkov AA. 2008. The role of mitochondria in reactive oxygen species metabolism and signaling. Ann. N. Y. Acad. Sci. 1147:37–52 - PMC - PubMed
    1. Cruciat CM, Brunner S, Baumann F, Neupert W, Stuart RA. 2000. The cytochrome bc1 and cytochrome c oxidase complexes associate to form a single supracomplex in yeast mitochondria. J. Biol. Chem. 275:18093–18098 - PubMed
    1. Schagger H, Pfeiffer K. 2000. Supercomplexes in the respiratory chains of yeast and mammalian mitochondria. EMBO J. 19:1777–1783 - PMC - PubMed
    1. Stuart RA. 2008. Supercomplex organization of the oxidative phosphorylation enzymes in yeast mitochondria. J. Bioenerg. Biomembr. 40:411–417 - PubMed
    1. Acin-Perez R, Fernandez-Silva P, Peleato ML, Perez-Martos A, Enriquez JA. 2008. Respiratory active mitochondrial supercomplexes. Mol. Cell 32:529–539 - PubMed

Publication types

MeSH terms