. 2013 Apr;141(4):445-65.
doi: 10.1085/jgp.201210856.

Construction and validation of a homology model of the human voltage-gated proton channel hHV1

Affiliations

Construction and validation of a homology model of the human voltage-gated proton channel hHV1

Kethika Kulleperuma et al. J Gen Physiol. 2013 Apr.

Abstract

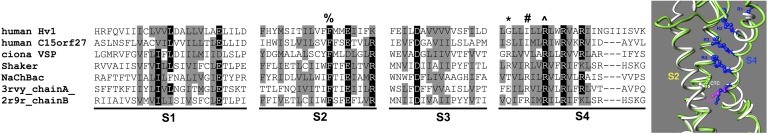
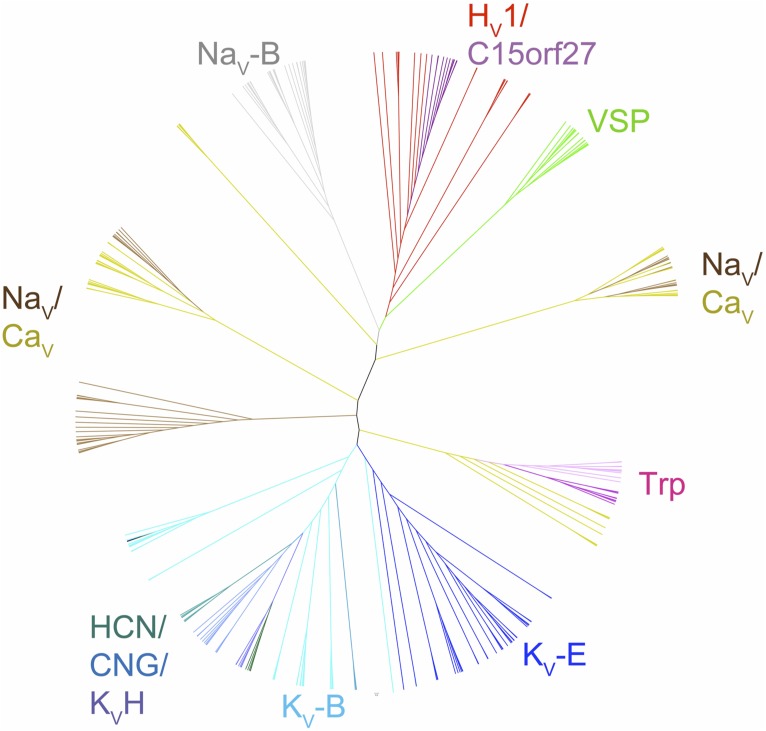
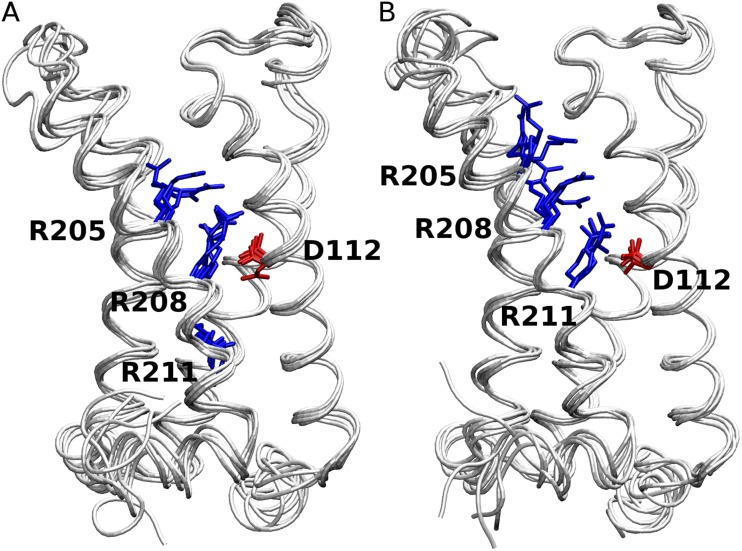
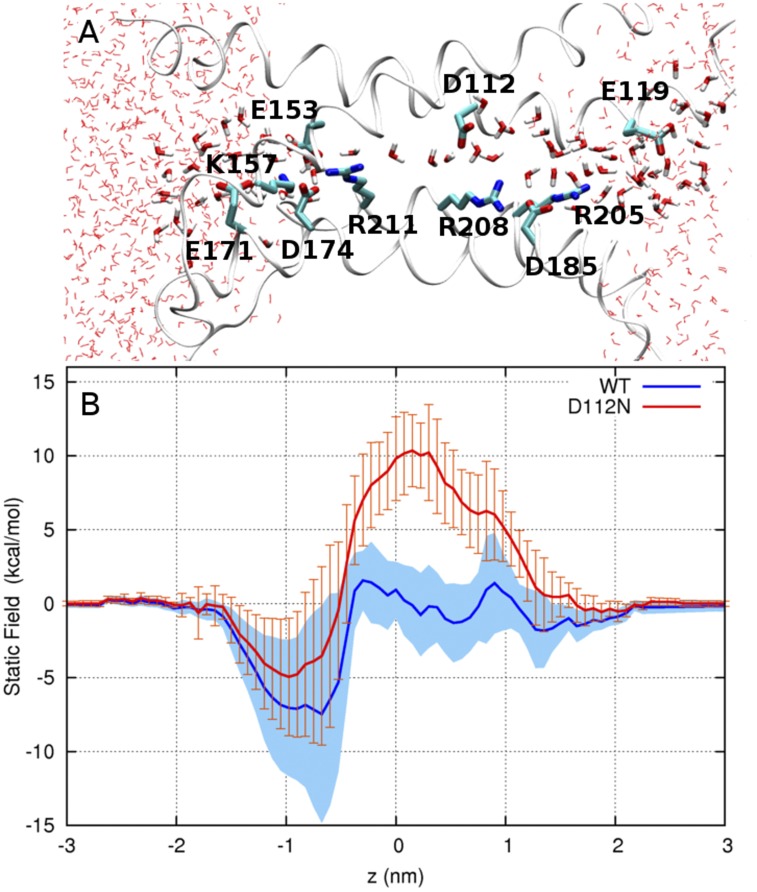
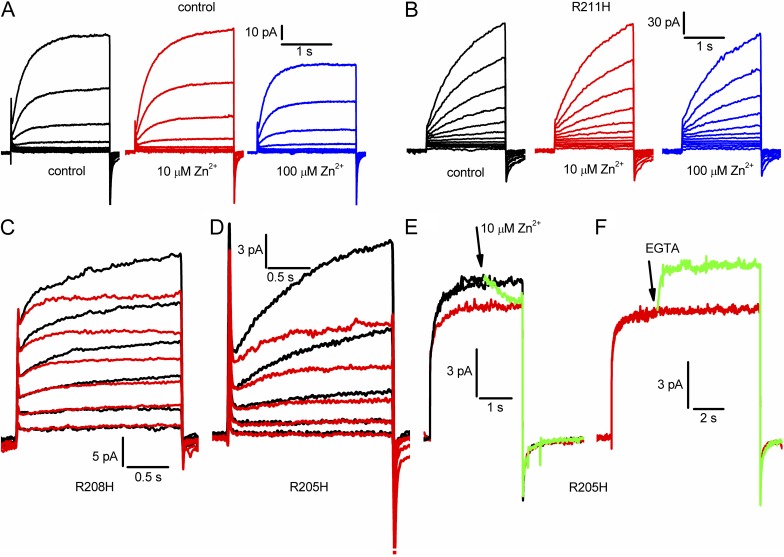
The topological similarity of voltage-gated proton channels (H(V)1s) to the voltage-sensing domain (VSD) of other voltage-gated ion channels raises the central question of whether H(V)1s have a similar structure. We present the construction and validation of a homology model of the human H(V)1 (hH(V)1). Multiple structural alignment was used to construct structural models of the open (proton-conducting) state of hH(V)1 by exploiting the homology of hH(V)1 with VSDs of K(+) and Na(+) channels of known three-dimensional structure. The comparative assessment of structural stability of the homology models and their VSD templates was performed using massively repeated molecular dynamics simulations in which the proteins were allowed to relax from their initial conformation in an explicit membrane mimetic. The analysis of structural deviations from the initial conformation based on up to 125 repeats of 100-ns simulations for each system reveals structural features consistently retained in the homology models and leads to a consensus structural model for hH(V)1 in which well-defined external and internal salt-bridge networks stabilize the open state. The structural and electrostatic properties of this open-state model are compatible with proton translocation and offer an explanation for the reversal of charge selectivity in neutral mutants of Asp(112). Furthermore, these structural properties are consistent with experimental accessibility data, providing a valuable basis for further structural and functional studies of hH(V)1. Each Arg residue in the S4 helix of hH(V)1 was replaced by His to test accessibility using Zn(2+) as a probe. The two outermost Arg residues in S4 were accessible to external solution, whereas the innermost one was accessible only to the internal solution. Both modeling and experimental data indicate that in the open state, Arg(211), the third Arg residue in the S4 helix in hH(V)1, remains accessible to the internal solution and is located near the charge transfer center, Phe(150).


Figures

Figure 1.
Figure 1.
A subset of a larger multiple sequence alignment of the four TM regions of VSDs informed by alignment of the open state produced by structural superposition of crystal structures of the paddle chimera (green ribbon) and NaVAB (white ribbon). The arginines of S4 (blue sticks) are labeled according to their position on the paddle chimera. Note that the most extracellular R of NaVAB corresponds to R2 of the paddle chimera, and the most intracellular R of NaVAB corresponds to K5 of the paddle chimera. The completely conserved phenylalanine on S2 is shown and labeled as “CTC.” The following residues are indicated with symbols over the alignment: %, CTC; *, R1 of Shaker; #, R2 of Shaker; ^, R3 of Shaker.
Figure 2.
Figure 2.
Phylogenetic tree constructed from the multiple sequence alignment of VSDs exemplified in Fig. 1. Branches and names of subfamilies of VSDs are color coded. KV-E, eukaryotic potassium channel; KV-B, prokaryotic potassium channel; KV-H, H family potassium channel; HCN, eukaryotic hyperpolarization–activated, cyclic nucleotide–gated; CNG, cyclic nucleotide–gated channel; Trp, transient receptor potential channel; NaV-E, eukaryotic sodium channel; NaV-B, prokaryotic sodium channel; CaV-E, eukaryotic calcium channel; HV1, voltage-gated proton channel; VSP, voltage-sensitive phosphatase; C15orf27, homologues of human C15orf27, a protein of unknown function.
Figure 3.
Figure 3.
Energy-minimized starting structures of the five models of R2D (A) and R3D (B) are superimposed. D112 in S1 and the three Arg residues in S4 are shown in red and blue, respectively. The channels are viewed from the side (membrane), and the external end is at the top.
Figure 4.
Figure 4.
Fraction of structures in the most populated cluster, shown as a percentage of the total population at each clustering cutoff value, Rc, for each of the three VSD templates and the two homology models.
Figure 5.
Figure 5.
Analysis of structural relaxation from massively repeated sampling. Relative probability distributions of (left) RMSD values (see Results) and (right) change in the number of α-helical residues, ΔNα, in the most populated cluster at each cutoff value (in nanometers, top right), relative to the starting structure of the simulations. The data are normalized to the total population.
Figure 6.
Figure 6.
Salt-bridge formation in the (A) R2D and (B) R3D model. Acidic and basic residues in the α-helical TM region (red, S1; yellow, S2; green, S3; blue, S4) are shown in licorice representation. The salt bridges present in >10% of the most populated cluster obtained with Rc = 0.1 nm and are highlighted in thick dotted lines.
Figure 7.
Figure 7.
Structural fluctuations of the two channel constrictions in model R2D. (A) Configurations of the D112–R208 salt bridge (from left to right: bidentate, monodentate, and open). Hydrogen bonds are shown as orange lines. (B) Probability distribution of d1, the distance between atom Cγ of D112 and atom Cz of R208. (C) Closed (left) and open (right) conformations of F150 and R211. (D) Probability distribution of d2, the distance between the center of the benzyl ring of F150 and atom Cz of R211. (E) Two-dimensional probability distribution of d1 and d2, with increasing probability from purple to yellow.
Figure 8.
Figure 8.
Pore hydration in the R2D model. Representative snapshots are shown successively for (A) the most constricted conformational state defined as d1 < 0.42 nm and d2 < 0.55 nm and (B) least constricted conformational state defined as d1 > 0.52 nm and d2 > 0.55 nm (see Fig. 7 E). Residues D112, F150, R208, and R211 are shown in licorice representation. Water molecules within 5 Å of these residues are colored in red and white, and hydrogen bonds between these molecules are shown with orange lines. (C) Water density within a 0.7-nm radius of the mean axis of the pore, normalized to the bulk water density in the most constricted and (D) least constricted conformational states, respectively. (E) Comparison of the water density profiles from four control simulations of 100 ns, successively in n-octane (blue) and in a POPC bilayer (magenta). Error bars represent the standard deviation.
Figure 9.
Figure 9.
Effect of the charge distribution of the channel on the energetics of ion translocation. (A) Representative snapshot of the water-filled open conformation of HV1. Water molecules and charged residues in the pore are shown in licorice representation; the extracellular end is to the right. (B) Static field energy for the transfer of a positive point charge in (blue) WT and (red) neutral-D112 forms of HV1. Two thick lines represent the mean of five running averages, each computed from a dataset of 30 snapshots using a five-point moving window. Blue shading and orange error bars represent the SEM.
Figure 10.
Figure 10.
Evaluation of external accessibility of the three Arg residues in the S4 helix of hHV1. All measurements were made in a construct designed to have low sensitivity to Zn2+, H140A/H193A/K221stop. (A) Currents during identical families of pulses in 10-mV increments up to +60 mV in the background construct in whole-cell configuration, in the presence of 0, 10, or 100 µM Zn2+ in the bath solution. (B) Whole-cell currents in the R211H mutant during identical families of pulses in 10-mV increments up to +80 mV, in the presence of 0, 10, or 100 µM Zn2+. (C) Currents during identical pulse families in 20-mV increments up to +60 mV in the R208H mutant in the absence (black) or presence of 10 µM Zn2+ (red). (D) Currents during identical pulse families in 10-mV increments up to +30 mV in the R205H mutant in the absence (black) or presence of 10 µM Zn2+ (red). (E) Currents during three consecutive pulses to +90 mV in a cell transfected with R205H. At or slightly before the arrow, 10 µM Zn2+ was applied to the bath, reducing the current during the pulse (green). The next pulse (red) shows the steady-state extent of Zn2+ inhibition. (F) Later in the same experiment, EGTA was added during a pulse at or before the arrow, rapidly relieving Zn2+ effects. For all parts, pHo was 7.0; pHi was 7.0 for A, B, E, and F; and pHi was 5.5 for C and D.
Figure 11.
Figure 11.
Evaluation of internal accessibility of Arg211 in the S4 helix of hHV1. All measurements are in inside-out patches at pHo 7.0, pHi 6.0. (A) Control families in the absence and presence of 0, 10, or 100 µM Zn2+ with pulses in 10-mV increments up to +60 mV. (B) Currents in an R211H patch during identical families of pulses in 10-mV increments up to +60 mV in the presence of 0 or 10 µM Zn2+. (C) Three consecutive pulses to +60 mV in an inside-out patch with the R211H mutant, first in the presence of 10 µM Zn2+ (red), and then with the addition of EGTA during the pulse (green), and finally in the absence of Zn2+ (black). The reversal of Zn2+ effects shows accessibility of R211H in the open state. For all parts, Vhold = −60 mV.

References

    1. Alabi A.A., Bahamonde M.I., Jung H.J., Kim J.I., Swartz K.J. 2007. Portability of paddle motif function and pharmacology in voltage sensors. Nature. 450:370–375 10.1038/nature06266 - DOI - PMC - PubMed
    1. Altschul S.F., Madden T.L., Schäffer A.A., Zhang J., Zhang Z., Miller W., Lipman D.J. 1997. Gapped BLAST and PSI-BLAST: a new generation of protein database search programs. Nucleic Acids Res. 25:3389–3402 10.1093/nar/25.17.3389 - DOI - PMC - PubMed
    1. Arinaminpathy Y., Biggin P.C., Shrivastava I.H., Sansom M.S.P. 2003. A prokaryotic glutamate receptor: homology modelling and molecular dynamics simulations of GluR0. FEBS Lett. 553:321–327 10.1016/S0014-5793(03)01036-6 - DOI - PubMed
    1. Beckstein O., Sansom M.S.P. 2006. A hydrophobic gate in an ion channel: the closed state of the nicotinic acetylcholine receptor. Phys. Biol. 3:147–159 10.1088/1478-3975/3/2/007 - DOI - PubMed
    1. Berger T.K., Isacoff E.Y. 2011. The pore of the voltage-gated proton channel. Neuron. 72:991–1000 10.1016/j.neuron.2011.11.014 - DOI - PMC - PubMed

Publication types