. 2013 Apr 9;110(15):E1352-60.
doi: 10.1073/pnas.1303060110. Epub 2013 Mar 25.

Hypoxia induces a phase transition within a kinase signaling network in cancer cells

Affiliations

Hypoxia induces a phase transition within a kinase signaling network in cancer cells

Wei Wei et al. Proc Natl Acad Sci U S A. .

Abstract

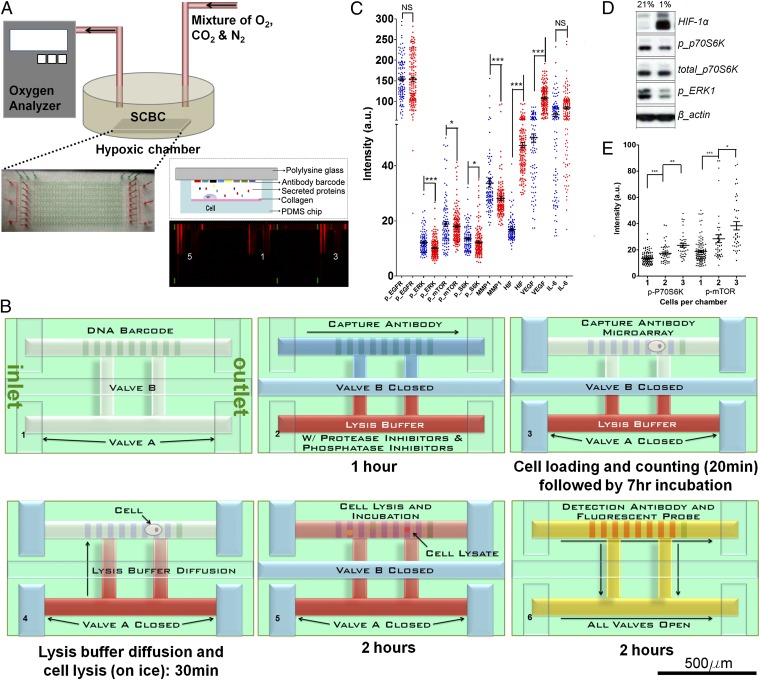
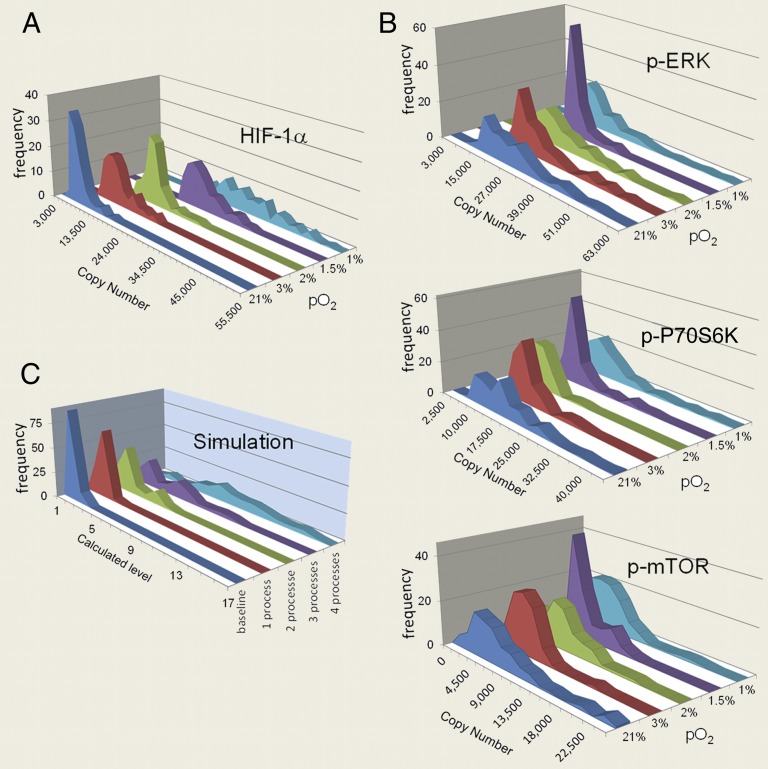
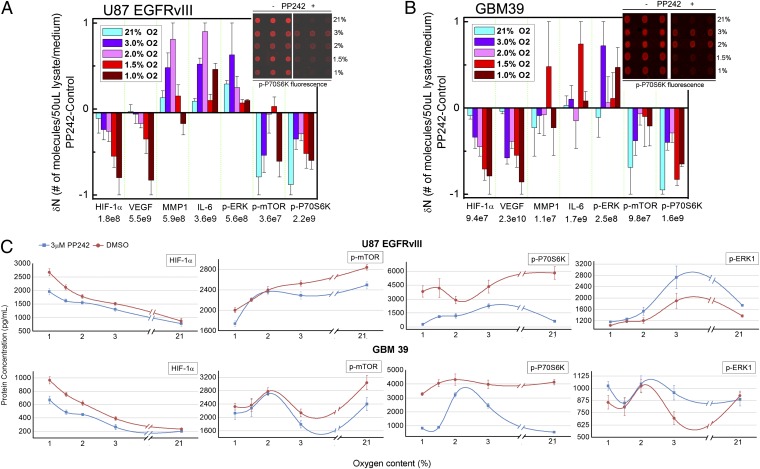
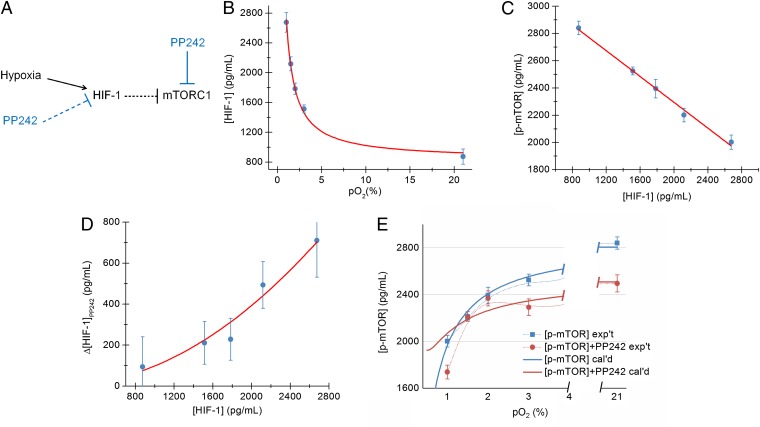
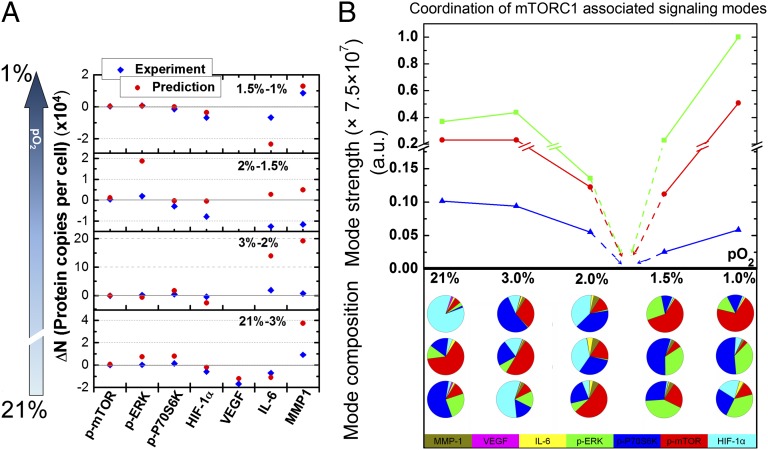
Hypoxia is a near-universal feature of cancer, promoting glycolysis, cellular proliferation, and angiogenesis. The molecular mechanisms of hypoxic signaling have been intensively studied, but the impact of changes in oxygen partial pressure (pO2) on the state of signaling networks is less clear. In a glioblastoma multiforme (GBM) cancer cell model, we examined the response of signaling networks to targeted pathway inhibition between 21% and 1% pO2. We used a microchip technology that facilitates quantification of a panel of functional proteins from statistical numbers of single cells. We find that near 1.5% pO2, the signaling network associated with mammalian target of rapamycin (mTOR) complex 1 (mTORC1)--a critical component of hypoxic signaling and a compelling cancer drug target--is deregulated in a manner such that it will be unresponsive to mTOR kinase inhibitors near 1.5% pO2, but will respond at higher or lower pO2 values. These predictions were validated through experiments on bulk GBM cell line cultures and on neurosphere cultures of a human-origin GBM xenograft tumor. We attempt to understand this behavior through the use of a quantitative version of Le Chatelier's principle, as well as through a steady-state kinetic model of protein interactions, both of which indicate that hypoxia can influence mTORC1 signaling as a switch. The Le Chatelier approach also indicates that this switch may be thought of as a type of phase transition. Our analysis indicates that certain biologically complex cell behaviors may be understood using fundamental, thermodynamics-motivated principles.


Conflict of interest statement

The authors declare no conflict of interest.

Figures

Fig. 1.
Fig. 1.
SCBC platform, experimental flowchart, and representative data. This SCBC design permits incubation of the cells within controlled pO2 environments, followed by multiplexed and quantitative assays of functional (secreted, membrane, and/or cytoplasmic) proteins from quantized cell populations. (A) Drawing of the custom-built hypoxia setup with real-time pO2 monitoring. The photograph is of an SCBC with the microchambers (red) and control valve layers (green) delineated with food dyes. (Lower Right) Side view of a single-cell microchamber with a representative readout image from the SCBC device. Each barcode fluorescent stripe corresponds to a specific protein assay. Signals from three microchambers with different cell numbers, indicated as 5, 1, and 3, are shown. (B) SCBC assay steps. DNA barcodes are converted into antibody barcodes using a mixture of DNA–antibody conjugates. Cells are then loaded and isolated into the upper chamber and incubated at a desired pO2, during which time secreted proteins are captured on designated barcode stripes. The chip is then cooled to near 0 °C, and the valve connecting the lysis buffer chamber is opened, leading to cell lysis within 15 min. The intracellular proteins are released and captured onto designated barcode stripes. (C) Scatter plots of assayed protein levels measured from U87 EGFRvIII single cells at 21% (blue dots) and 1% (red dots) pO2. The averaged fluorescence intensity with SEM is overlaid for each protein. Statistical uniqueness is evaluated by two-tailed Student t test assuming unequal variance (NS, not significant; *P < 0.05; **P < 0.005; ***P < 0.0005). (D) Western blotting results for several of the cytoplasmic proteins from U87 EGFRvIII cells assayed at 21% and 1% pO2. (E) Scatter plots of the assayed levels of p-P70S6K and p-mTOR at 21% pO2 for individual microchambers containing one, two, or three cells, indicating the statistical uniqueness of data sets representing different quantized cell populations.
Fig. 2.
Fig. 2.
Measured single-cell fluctuations for four cytoplasmic proteins as a function of pO2, and a simulation of fluctuations for a hypothetical protein. (A) Single-cell fluctuation profiles for HIF-1α at various pO2. (B) Single-cell fluctuations for p-mTOR, p-P70S6K, and p-ERK1 at various pO2. Note that these fluctuations exhibit a sharpening at 1.5% pO2. (C) Single-cell fluctuation profiles from a Monte Carlo simulation that assumes a hypothetical protein participates in varying numbers of functional processes. Note the comparison of this simulation to the measured fluctuations of HIF-1α.
Fig. 3.
Fig. 3.
The influence of the mTOR inhibitor PP242 on the assayed protein levels for GBM cell lines and xenograft neurosphere tumor models, as a function of pO2. (A and B) Bar graphs showing the changes in protein copy number, as measured from bulk-cell lysate of the U87 EGFRvIII cells and the GBM39 tumor model. Protein level changes are normalized by the number listed below the corresponding protein name. (Insets) Fluorescence images of the developed assays of the highly expressed mTOR effector, p-P70S6K. (C) Plot of protein concentrations at various pO2 joined with spline fit for control and PP242-treated U87 EGFRvIII cells (Upper) and GBM39 neurospheres (Lower). Note that the drug treated and untreated levels coincide for p-mTOR, p-P70S6K, and p-ERK1 for both model systems near 1.5–2% pO2. Error bars represent SDs of the measurements.
Fig. 4.
Fig. 4.
The network hypothesis and accompanying steady-state kinetic model describing relationships among HIF-1α, p-mTOR, PP242, and pO2 in U87 EGFRvIII cells reveal a switch in mTOR regulation below 1.5% pO2. Bracketed protein names indicate the concentration of that protein in pg/mL. (A) The network drawing indicates (net) effective activating (arrow) and inhibiting (bar) interactions. The functional forms of those interactions represent the fitted or predicted parameters, using steady-state kinetic relationships. (B) The levels of HIF-1α fit well to a steady-state kinetic model predicting a hyperbolic increase in HIF-1α with decreasing pO2. (C) [p-mTOR] exhibits an inverse linear relationship with [HIF-1α]. (D) The change in HIF-1α levels upon addition of a 3-µM solution of PP242 exhibits a quadratic dependence upon [HIF-1α]. (E) The fitted parameters from the model are used to calculate [p-mTOR] in terms of pO2 in the presence and absence of PP242, and compared against experiments (the points connected by lighter lines). The calculation predicts a pO2 level where the solid red and blue lines cross, or where PP242 does not inhibit p-mTOR. However, the model also predicts PP242 activates p-mTOR at pO2 levels above this crossing point, which is clearly not observed. This disagreement implies that different regulators of mTOR are important in the regime of moderate-to-severe hypoxia.
Fig. 5.
Fig. 5.
The use of a quantitative Le Chatelier principle reveals an oxygen partial pressure-dependent phase transition in the mTORC1 signaling network within model GBM cells. (A) Measured and predicted changes for the panel of assayed proteins, as pO2 is changed between specified levels. The agreement between experiment and prediction for 21–3% and 1.5–1% implies that these pO2 changes constitute only a weak perturbation on the signaling network. The change from 3% to 2% pO2 represents a somewhat stronger perturbation, whereas for the range 2–1.5% pO2, a strong perturbation is indicated by the qualitative disagreement between prediction and experiment. (B) The coordination of mTOR-associated signaling modes, as a function of pO2, is reflected in an analysis of the relevant eigenvalues (mode strength) and their composition of the protein–protein covariance matrix (mode composition). The coordination of mTOR with its effectors, p-ERK and p-P70S6K, dominates the composition of the three lowest-amplitude eigenvectors, which exhibit singular behavior between 2% and 1.5% pO2. Experimentally determined points are connected by solid lines; dashed lines imply that the amplitudes of the three eigenvectors will reach a (shallow) minimum (loss of mTOR signaling coordination), which is indicative of a phase transition. Each column of the pie charts represents the compositions of the three lowest-amplitude eigenvectors at the corresponding pO2; they reflect a shift in the coordination of mTOR signaling across the phase transition. Note the importance of HIF-1α in these eigenvectors at pO2 ≥ 2%, and the importance of p-ERK below 2%.

References

    1. Provenzano PP, et al. Enzymatic targeting of the stroma ablates physical barriers to treatment of pancreatic ductal adenocarcinoma. Cancer Cell. 2012;21(3):418–429. - PMC - PubMed
    1. Goel S, et al. Normalization of the vasculature for treatment of cancer and other diseases. Physiol Rev. 2011;91(3):1071–1121. - PMC - PubMed
    1. Bertout JA, Patel SA, Simon MC. The impact of O2 availability on human cancer. Nat Rev Cancer. 2008;8(12):967–975. - PMC - PubMed
    1. Brown JM, Wilson WR. Exploiting tumour hypoxia in cancer treatment. Nat Rev Cancer. 2004;4(6):437–447. - PubMed
    1. Collingridge DR, Piepmeier JM, Rockwell S, Knisely JP. Polarographic measurements of oxygen tension in human glioma and surrounding peritumoural brain tissue. Radiother Oncol. 1999;53(2):127–131. - PubMed

Publication types