. 2013;20(19):2486-99.
doi: 10.2174/0929867311320190008.

MEK inhibition increases lapatinib sensitivity via modulation of FOXM1

Affiliations

MEK inhibition increases lapatinib sensitivity via modulation of FOXM1

S S Gayle et al. Curr Med Chem. 2013.

Abstract

The standard targeted therapy for HER2-overexpressing breast cancer is the HER2 monoclonal antibody, trastuzumab. Although effective, many patients eventually develop trastuzumab resistance. The dual EGFR/HER2 small molecule tyrosine kinase inhibitor lapatinib is approved for use in trastuzumab-refractory metastatic HER2-positive breast cancer. However, lapatinib resistance is a problem as most patients with trastuzumab-refractory disease do not benefit from lapatinib. Understanding the mechanisms underlying lapatinib resistance may ultimately facilitate development of new therapeutic strategies for HER2-overexpressing breast cancer. Our current results indicate that MEK inhibition increases lapatinib-mediated cytotoxicity in resistant HER2-overexpressing breast cancer cells. We genetically and pharmacologically blocked MEK/ERK signaling and evaluated lapatinib response by trypan blue exclusion, anchorage-independent growth assays, flow cytometric cell cycle and apoptosis analysis, and in tumor xenografts. Combined MEK inhibition and lapatinib treatment reduced phosphorylated ERK more than single agent treatment. In addition, Western blots, immunofluorescence, and immunohistochemistry demonstrated that the combination of MEK inhibitor plus lapatinib reduced nuclear expression of the MEK/ERK downstream proto-oncogene FOXM1. Genetic knockdown of MEK was tested for the ability to increase lapatinib-mediated cell cycle arrest or apoptosis in JIMT-1 and MDA361 cells. Finally, xenograft studies demonstrated that combined pharmacological inhibition of MEK plus lapatinib suppressed tumor growth and reduced expression of FOXM1 in HER2-overexpressing breast cancers that are resistant to trastuzumab and lapatinib. Our results suggest that FoxM1 contributes to lapatinib resistance downstream of MEK signaling, and supports further study of pharmacological MEK inhibition to improve response to lapatinib in HER2-overexpressing trastuzumab-resistant breast cancer.


Conflict of interest statement

CONFLICTS OF INTEREST

The authors declare that there are not any conflicts of interest pertaining to the work discussed in this article.

Figures
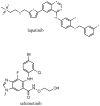
Figure 1
Figure 1
The structures for lapatinib and selumetinib were drawn in ChemDraw Ultra 12.0 (CambridgeSoft Corporation) and are shown here.
Figure 2
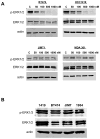
Figure 2. Sustained MEK Signaling in lapatinib-resistant cells
(A) BT474, HCC1419, JIMT-1, and MDA361 cells were treated with the control vehicle (C), 50, 100, 500, or 1000 nM lapatinib for 24 hours. Whole cell protein lysates were immunoblotted for p-ERK, total ERK or actin loading control. Blots were repeated at least three times with reproducible results. Lapatinib did not reduce ERK phosphorylation in JIMT-1 and MDA361 cells. (B) Untreated BT474, HCC1419, JIMT-1, and HCC1954 cells were lysed and immunoblotted for basal p-ERK, total ERK and actin loading control. Blots were repeated at least three times with reproducible results. No differences in baseline phosphorylated ERK were observed between lines.
Figure 3
Figure 3. MEK inhibition by PD0325901 (P) increases lapatinib (L) response
(A) In the blots to the left, JIMT-1 cells were treated with 1000 nM L, 10 nM P, combination 1000 nM L and 10 nM P, or vehicle control (C) for 24 hours. In the blots to the right, JIMT-1 cells were treated with 1000 nM L, 1000 nM P, combination 1000 nM L and 1000 nM P, or vehicle control (C) for 24 hours. Whole cell protein lysates were immunoblotted for p-ERK, total ERK, p-Akt, total Akt, or actin loading control. Blots were repeated at least twice with reproducible results. Combined lapatinib plus P suppressed phosphorylation of ERK to a greater degree than either drug alone and suppressed compensatory up-regulation of Akt phosphorylation. (B) JIMT-1 cells were plated in matrigel and treated with vehicle control, 1000 nM L, 10 nM P, or a combination of 1000 nM L and 10 nM P. Media plus drugs were changed every 3 days for approximately 2 weeks. Representative photos of colony growth in each treatment group are shown at 4× magnification. (C) Matrigel from the growth assays in (B) was dissolved with dispase, and the number of cells was counted by trypan blue. Viability is presented as a percentage of DMSO control, and reflects an average of three replicates per treatment group. Error bars represent the standard deviation between replicates. Experiments were repeated at least three times with reproducible results. Lapatinib plus P reduced growth in matrigel versus lapatinib alone; *p<0.05.
Figure 4
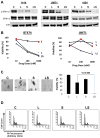
Figure 4. MEK inhibition by selumetinib (S) increases lapatinib (L) response
(A) HCC1419, JIMT-1, and HCC1954 cells were treated with the control vehicle (DMSO), 1000 nM L, 1000 nM S, or a combination of 1000 nM L and 1000 nM S (LS) for 24 hours. Whole cell protein lysates were immunoblotted for p-ERK, total ERK, or actin loading control. Blots were repeated on at least three separate occasions with reproducible results. Combined lapatinib plus selumetinib suppressed phosphorylation of ERK to a greater degree than either drug alone. (B) BT474 and JIMT-1 cells were plated at 3 × 10⁴ in a 12-well plate format. After 24 hours, cells were treated with either L (10, 100, or 1000 nM), S (10, 100, or 1000 nM), or combination L plus S. Viable cells were counted by trypan blue exclusion after 72 hours and are reported as a percentage of control cells. Experiments were repeated twice with reproducible results. Lapatinib plus selumetinib reduced survival of JIMT-1 cells versus lapatinib or selumetinib alone; *p< 0.05. (C) JIMT-1 cells were plated in matrigel and treated with vehicle control DMSO, 1000 nM L, 10 nM S, or a combination of 1000 nM L and 10 nM S (LS). Media plus drugs were changed every 3 days for approximately two weeks. Representative photos of colony growth in each treatment group are shown at 4× magnification. Matrigel was dissolved with dispase, and viable cells were counted by trypan blue. Viability is presented as a percentage of DMSO control group, and reflects an average of three replicates per treatment group. Error bars represent the standard deviation between replicates. Experiments were repeated twice with reproducible results. Lapatinib plus selumetinib reduced growth of JIMT-1 cells in matrigel versus lapatinib alone; **p<0.005. (D) JIMT-1 cells were treated with DMSO control (C), 1000 nM L, 1000 nM S, or LS for 48 hours, fixed, stained with propidium iodide, and analyzed by flow cytometry. Cell cycle profiles are displayed. Triplicate cultures were run per treatment group, and the experiment was repeated three times.
Figure 5
Figure 5. MEK knockdown increases lapatinib (L) response
(A) JIMT-1 cells were transfected with 100 nM control siRNA (si-C) or MEK1/2 siRNA (si-MEK) for 24 hours, and then treated with DMSO control (C), or 1000 nM L for 48 hours. Total protein lysates were immunoblotted for MEK1/2, p-ERK, total ERK, and actin loading control to confirm knockdown. Knockdown of MEK was confirmed. The combination of MEK knockdown plus lapatinib suppressed ERK phosphorylation to a greater degree than MEK knockdown or lapatinib alone. (B) JIMT-1 cells were transfected with 100 nM control siRNA (si-C) or MEK1/2 siRNA for 24 hours and then treated with DMSO control (C) or 1000 nM L. After 48 hours, surviving cells were counted by trypan blue exclusion. Viability is presented as a percentage of DMSO-treated, si-C-transfected cells and reflects the average of 3 replicates per treatment group. Error bars represent standard deviation between replicates. P-values were determined by t-test for MEK1/2 knockdown plus lapatinib versus control siRNA plus lapatinib. MEK knockdown plus lapatinib showed significantly reduced cell survival versus lapatinib and control siRNA; **p<0.005. Experiments were repeated at least three times with reproducible results. (C) JIMT-1 cells were transfected with 100 nM control siRNA (si-C) or MEK1/2 siRNA (si-MEK) for 24 hours and then treated with vehicle control (C) or 1000 nM L for 24 hours. Cells were stained with annexin V-FITC and propidium iodide and analyzed by flow cytometry. The top panels show dot plots of the cells. Quadrant 2 (Q2) shows late apoptotic cells (positive for both Annexin V-FITC and propidium iodide staining). Quadrant 3 (Q3) shows normal viable cells. Quadrant 4 (Q4) shows early apoptotic cells (Annexin V-FITC positive). The bottom graph shows quantification of the mean percentages of cells in each quadrant with Q4 showing increased apoptosis in cells treated with lapatinib plus selumetinib.
Figure 6
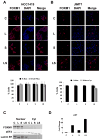
Figure 6. FOXM1 localization and expression in response to lapatinib plus selumetinib treatment
(A) HCC1419 and (B) JIMT-1 cells were plated on glass coverslips for 24 hours before being treated with vehicle control, 1000 nM L, 1000 nM S, or a combination of 1000 nM L plus 1000 nM S (LS) for 24 hours. Immunofluorescence was performed to determine the cellular location of total FOXM1. Cells were observed at a magnification of 40×. Graphs are a quantification of the IF data from 10 samples per treatment demonstrating the percentage of cells expressing FOXM1 in the nucleus or nucleus plus cytoplasm versus the percentage of cells expressing FOXM1 in the cytoplasm or cytoplasm plus nucleus. The data indicated that lapatinib and selumetinib did not alter localization of FOXM1 in lapatinib-sensitive HCC1419 cells. In contrast, JIMT-1 cells, which expressed FOXM1 primarily in the nucleus at baseline, showed an increased percentage of cells staining positive for FOXM1 in the cytoplasm when treated with lapatinib plus selumetinib. (C) Western blot analysis detecting FOXM1 from the nuclear and cytoplasmic fractions of JIMT-1 cells treated with DMSO control, 1000 nM lapatinib (L), 1000 nM selumetinib (S), or combination LS for 24 hours. Lamin B (nuclear) and eEF2 (cytoplasmic) were used as fractionation controls. The combination reduced expression of nuclear FOXM1. (D) Real-time PCR was performed for FOXM1 downstream target p27 in JIMT-1 cells that had been treated with DMSO control, 1000 nM L, 1000 nM selumetinib S, or combination LS for 24 hours. Values reflect the fold change in transcript normalized to RPLPO housekeeping gene. Lapatinib induced p27 transcript levels. The combination caused an even greater induction in p27 levels.
Figure 7
Figure 7. Modulation of FOXM1 expression affects lapatinib sensitivity
(A) JIMT-1 cells were transfected with 100 nM control siRNA (si-C) or FOXM1 siRNA (si-FM1) for 24 hours, and then treated with DMSO control vehicle (C) or 1000 nM Lapatinib (L) for 24h. Total protein lysates were immunoblotted for FOXM1 to confirm knockdown and actin. Alternatively, after 48 hours of drug treatment, surviving cells were counted by trypan blue exclusion. Viability is presented as a percentage of DMSO-treated control siRNA-transfected cells and reflects the average of 3 replicates per treatment group. Error bars represent standard deviation between replicates. P-values were determined by t-test for FOXM1 knockdown plus L versus si-C plus L; **p<0.005. Experiments were repeated three times with reproducible results. FOXM1 knockdown reduced viability of JIMT-1 cells, with addition of lapatinib further reducing cell survival. (B) JIMT-1 cells were plated at 3 × 10⁴ in a 12-well plate format. After 24 hours, cells were treated with DMSO control, 1000 nM L, 2000 μM thiostrepton (T), or combination L plus T. Viable cells were counted after 48 hours by trypan blue exclusion and are reported relative to control cells. Error bars represent standard deviation between replicates. Experiments were repeated three times with reproducible results. P-values were determined by t-test for L treatment versus FOXM1 inhibition plus L. Viability was significantly reduced by lapatinib plus thiostrepton versus lapatinib alone; **p<0.005. (C) HCC1954 and JIMT-1 cells were plated in matrigel and treated with control, 1000 nM L, 2000 nM T, or combination 1000 nM L and 2000 nM T. Media plus drugs were changed every 3 days for approximately 2 weeks. Matrigel was dissolved with dispase, and viable cells were counted by trypan blue. Viability is presented as a percentage of DMSO control, and reflects an average of 3 replicates per treatment group. Error bars represent the standard deviation between replicates. Experiments were repeated three with reproducible results. P-value was determined by t-test for combination treatment versus lapatinib alone. Clonogenic growth was significantly reduced by lapatinib plus thiostrepton versus either agent alone in HCC1954 (**p<0.005) and JIMT-1 (*p<0.05) cells. (D) In the graph on the left, real-time PCR was performed for FOXM1 in HCC1419 cells that had been transfected with either 5μg pCMV-FOXM1 plasmid (pFM1) or control CMV plasmid (pCMV). Values reflect the fold change in transcript normalized to RPLPO housekeeping gene. In blot to the right, HCC1419 cells were transfected with either pCMV (C) or 2μg pFM1 for 24 hours. Total protein lysates were immunoblotted for FOXM1 to confirm overexpression and actin loading control. In the graph on the right, HCC1419 cells were transfected with 2 μg pCMV or pFM1 for 24 hours and then treated with DMSO control (C) or 1000 nM lapatinib (L) for another 48 hours. Viability measured by trypan blue exclusion is presented as a percentage of DMSO-treated pCMV and reflects the average of 3 replicates per treatment group. Error bars represent standard deviation between replicates. Experiments were repeated three times with reproducible results. P-values were determined by t-test for FOXM1 plus L versus vector control plus L; **p<0.005
Figure 8
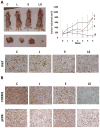
Figure 8. The combination of selumetinib plus lapatinib suppresses tumor growth of JIMT-1 trastuzumab-resistant HER2-overexpressing breast cancer xenografts
JIMT-1 cells were injected s.c. in the flank of athymic mice. After palpable tumors formed, tumors were treated daily (5 days on, 2 days off) with vehicle control (n=3), 75 mg/kg oral lapatinib (n=3), 50 mg/kg oral selumetinib (n=3), or combination lapatinib plus selumetinib (n=3). (A). The top panel is a representative picture of an animal from each treatment group and the bottom panel is a representative picture of the excised tumor from one animal in each treatment group. In the graph to the right, mean tumor volume is shown per treatment group, with error bars representing the standard deviation between replicates. P-value was determined by t-test for combination treatment versus lapatinib alone for each week that measurements were taken; *p<0.05. Bottom IHC shows a representative picture of an animal from each treatment group stained for Ki67. (B) Staining for FOXM1 and pERK in a representative picture of an animal from each treatment group. All IHC photos were taken at 10× magnification.
Figure 9
Figure 9. Proposed model and summary
Lapatinib, a dual EGFR/HER2 kinase inhibitor, inhibits cell proliferation and survival by blocking the PI3K/Akt/mTOR (previously demonstrated by Gayle et al [9]) and MEK/ERK pathways. Based on our data, sustained activation of the MEK/ERK pathway in the presence of lapatinib is associated with reduced response to lapatinib. In this study, we inhibit MEK1/2 genetically using siRNA and pharmacologically using PD0325901 and selumetinib. FOXM1 was inhibited genetically using siRNA, pharmacologically using thiostrepton, and overexpressed using a FOXM1-CMV plasmid.

References

    1. Bublil EM, Yarden Y. The EGF receptor family: spearheading a merger of signaling and therapeutics. Current opinion in cell biology. 2007;19:124–134. - PubMed
    1. Citri A, Yarden Y. EGF-ERBB signalling: towards the systems level. Nature reviews Molecular cell biology. 2006;7:505–516. - PubMed
    1. Yarden Y, Sliwkowski MX. Untangling the ErbB signalling network. Nature reviews Molecular cell biology. 2001;2:127–137. - PubMed
    1. Eccles SA. The role of c-erbB-2/HER2/neu in breast cancer progression and metastasis. J Mammary Gland Biol Neoplasia. 2001;6:393–406. - PubMed
    1. Slamon DJ, Clark GM, Wong SG, Levin WJ, Ullrich A, McGuire WL. Human breast cancer: correlation of relapse and survival with amplification of the HER-2/neu oncogene. Science. 1987;235:177–182. - PubMed

Publication types

MeSH terms