Comparative Study
. 2013 Mar 26:10:9.
doi: 10.1186/1743-8977-10-9.

Comparative absorption, distribution, and excretion of titanium dioxide and zinc oxide nanoparticles after repeated oral administration

Affiliations
Comparative Study

Comparative absorption, distribution, and excretion of titanium dioxide and zinc oxide nanoparticles after repeated oral administration

Wan-Seob Cho et al. Part Fibre Toxicol. .

Abstract

Background: The in vivo kinetics of nanoparticles is an essential to understand the hazard of nanoparticles. Here, the absorption, distribution, and excretion patterns of titanium dioxide (TiO2) and zinc oxide (ZnO) nanoparticles following oral administration were evaluated.

Methods: Nanoparticles were orally administered to rats for 13 weeks (7 days/week). Samples of blood, tissues (liver, kidneys, spleen, and brain), urine, and feces were obtained at necropsy. The level of Ti or Zn in each sample was measured using inductively coupled plasma-mass spectrometry.

Results: TiO₂ nanoparticles had extremely low absorption, while ZnO nanoparticles had higher absorption and a clear dose-response curve. Tissue distribution data showed that TiO₂ nanoparticles were not significantly increased in sampled organs, even in the group receiving the highest dose (1041.5 mg/kg body weight). In contrast, Zn concentrations in the liver and kidney were significantly increased compared with the vehicle control. ZnO nanoparticles in the spleen and brain were minimally increased. Ti concentrations were not significantly increased in the urine, while Zn levels were significantly increased in the urine, again with a clear dose-response curve. Very high concentrations of Ti were detected in the feces, while much less Zn was detected in the feces.

Conclusions: Compared with TiO₂ nanoparticles, ZnO nanoparticles demonstrated higher absorption and more extensive organ distribution when administered orally. The higher absorption of ZnO than TiO₂ nanoparticles might be due to the higher dissolution rate in acidic gastric fluid, although more thorough studies are needed.


Figures

Figure 1
Figure 1
SEM and TEM of TiO2 and ZnO nanoparticles. SEM (A) and TEM (B) images of TiO2 nanoparticles show spherical shape. SEM (C) and TEM (D) images of ZnO nanoparticles show hexagonal shape.
Figure 2
Figure 2
Dissolution pattern of nanoparticles in the acidic gastric fluid. AGF, pH 1.5; basic condition, DW, pH 7.4. Nanoparticles were incubated with AGF or DW for up to 24 h. (A) Image taken 5 min after incubation using a digital camera. (B) Percentage of dissolution measured using an ICP-MS at 24 h after incubation.
Figure 3
Figure 3
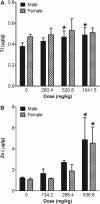
Systemic absorption of nanoparticles from the gastrointestinal tract after 13 weeks of repeated oral treatment. Ti concentration in whole blood (A) showed about a 10-fold lower absorption than Zn concentration in whole blood (B) in both sexes. Values are mean ± S.D. and n = 11. Significance versus vehicle control: *p < 0.05.
Figure 4
Figure 4
Concentration of Ti in tissues after 13 weeks of consecutive oral administration of TiO2 nanoparticles. The concentrations of Ti in the liver (A), spleen (B), kidney (C), and brain (D) were evaluated using an ICP-MS. Values are mean ± S.D. and n = 11. Significance versus vehicle control: *p < 0.05.
Figure 5
Figure 5
Concentration of Zn in tissues after 13 weeks of consecutive oral administration of ZnO nanoparticles. The concentrations of Zn in the liver (A), spleen (B), kidney (C), and brain (D) were evaluated using an ICP-MS. Values are mean ± S.D. and n = 11. Significance versus vehicle control: *p < 0.05.
Figure 6
Figure 6
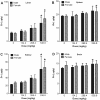
Excretion of nanoparticles after 13 weeks of consecutive oral administration. The concentrations of Ti in urine (A) and feces (C) were measured using an ICP-MS for TiO2 treatment groups. The concentrations of Zn in urine (B) and feces (D) were measured using an ICP-MS for ZnO treatment groups. Values are mean ± S.D. and n = 11. Significance versus vehicle control: *p < 0.05.

References

    1. Rashidi L, Khosravi-Darani K. The applications of nanotechnology in food industry. Crit Rev Food Sci Nutr. 2011;51(8):723–730. doi: 10.1080/10408391003785417. - DOI - PubMed
    1. Chun AL. Will the public swallow nanofood? Nat Nanotechnol. 2009;4(12):790–791. doi: 10.1038/nnano.2009.359. - DOI - PubMed
    1. Wang J, Zhou G, Chen C, Yu H, Wang T, Ma Y, Jia G, Gao Y, Li B, Sun J. Acute toxicity and biodistribution of different sized titanium dioxide particles in mice after oral administration. Toxicol Lett. 2007;168(2):176–185. doi: 10.1016/j.toxlet.2006.12.001. - DOI - PubMed
    1. Lin CC, Lin WJ. Sun protection factor analysis of sunscreens containing titanium dioxide nanoparticles. J Food Drug Anal. 2011;19(1):1–8.
    1. Ge Y, Schimel JP, Holden PA. Identification of soil bacteria susceptible to TiO2 and ZnO nanoparticles. Appl Environ Microbiol. 2012;78(18):6749–6758. doi: 10.1128/AEM.00941-12. - DOI - PMC - PubMed

Publication types

MeSH terms