

Population structure, migration, and diversifying selection in the Netherlands
- PMID: 23531865
- PMCID: PMC3798851
- DOI: 10.1038/ejhg.2013.48
Population structure, migration, and diversifying selection in the Netherlands
Abstract
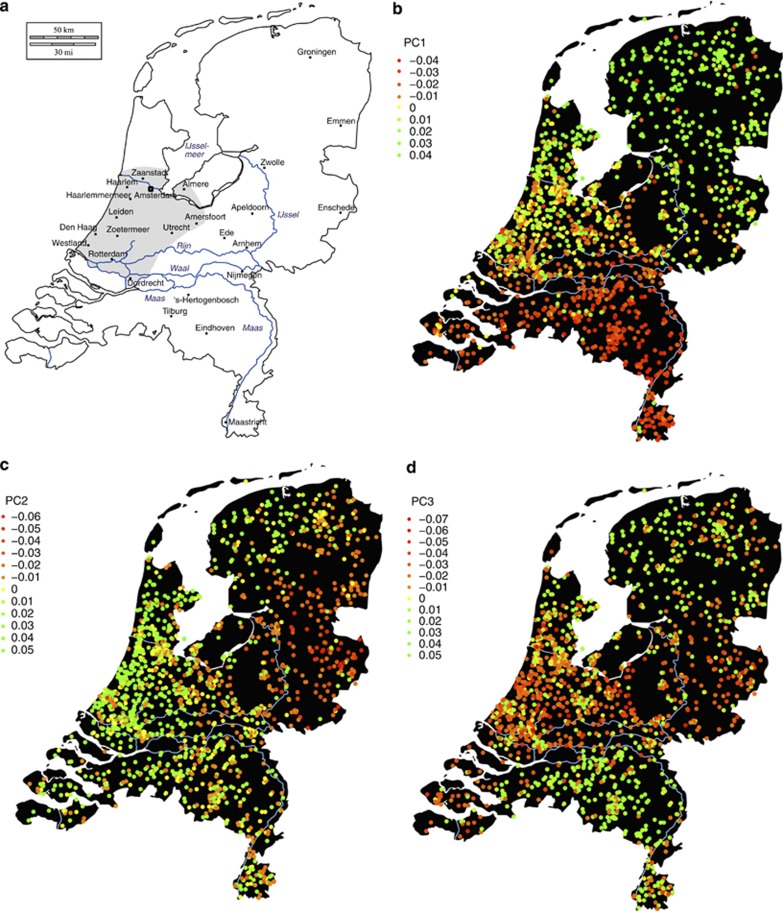
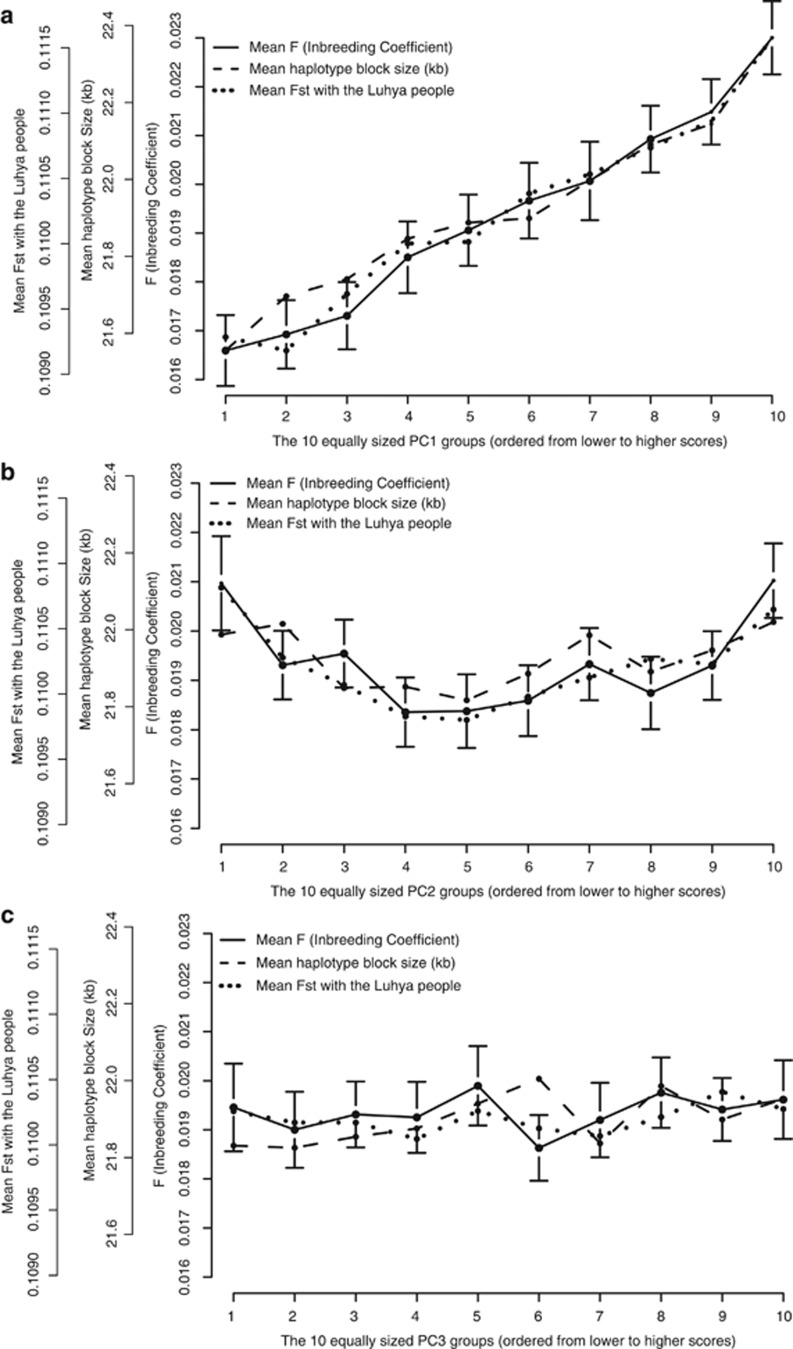
Genetic variation in a population can be summarized through principal component analysis (PCA) on genome-wide data. PCs derived from such analyses are valuable for genetic association studies, where they can correct for population stratification. We investigated how to capture the genetic population structure in a well-characterized sample from the Netherlands and in a worldwide data set and examined whether (1) removing long-range linkage disequilibrium (LD) regions and LD-based SNP pruning significantly improves correlations between PCs and geography and (2) whether genetic differentiation may have been influenced by migration and/or selection. In the Netherlands, three PCs showed significant correlations with geography, distinguishing between: (1) North and South; (2) East and West; and (3) the middle-band and the rest of the country. The third PC only emerged with minimized LD, which also significantly increased correlations with geography for the other two PCs. In addition to geography, the Dutch North-South PC showed correlations with genome-wide homozygosity (r=0.245), which may reflect a serial-founder effect due to northwards migration, and also with height (♂: r=0.142, ♀: r=0.153). The divergence between subpopulations identified by PCs is partly driven by selection pressures. The first three PCs showed significant signals for diversifying selection (545 SNPs - the majority within 184 genes). The strongest signal was observed between North and South for the functional SNP in HERC2 that determines human blue/brown eye color. Thus, this study demonstrates how to increase ancestry signals in a relatively homogeneous population and how those signals can reveal evolutionary history.
Figures
References
-
- Manni F. Interview with Luigi Luca Cavalli-Sforza: past research and directions for future investigations in human population genetics. Hum Biol. 2010;82:245–266. - PubMed
Publication types
MeSH terms
Grants and funding
LinkOut - more resources
Full Text Sources
Other Literature Sources
Research Materials
