. 2013:3:1554.
doi: 10.1038/srep01554.

Photostimulated near-infrared persistent luminescence as a new optical read-out from Cr³⁺-doped LiGa₅O₈

Affiliations

Photostimulated near-infrared persistent luminescence as a new optical read-out from Cr³⁺-doped LiGa₅O₈

Feng Liu et al. Sci Rep. 2013.

Abstract

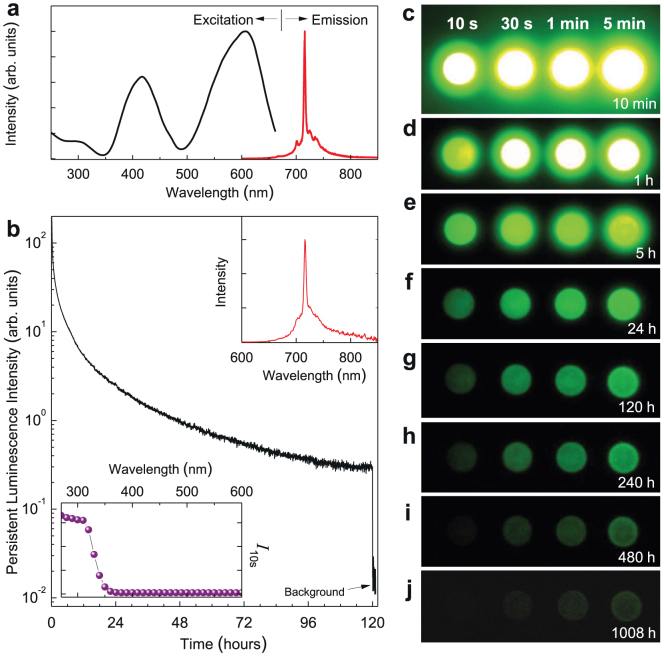
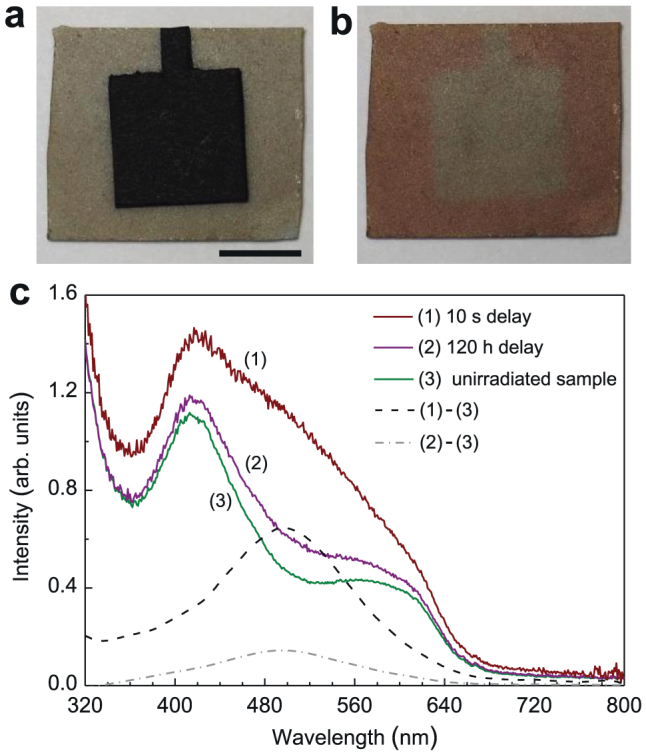
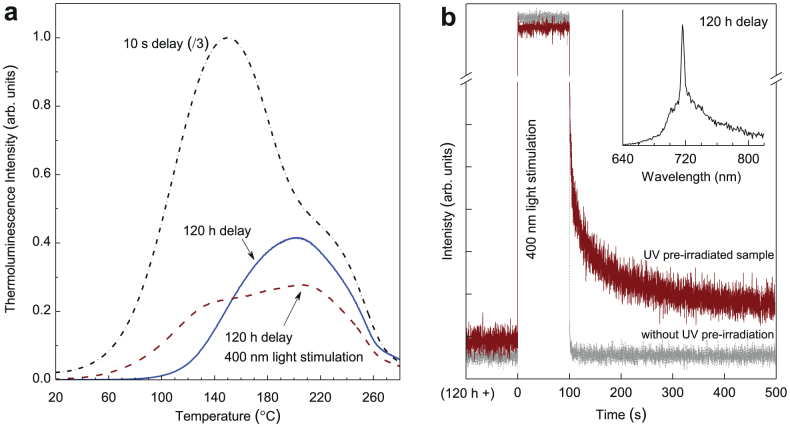
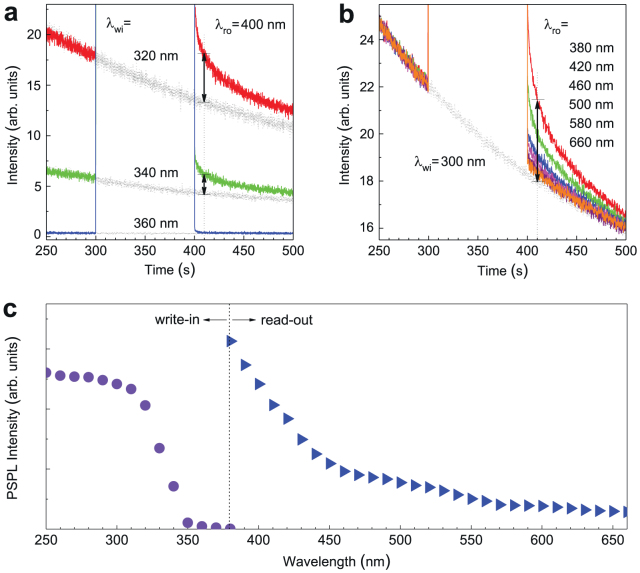
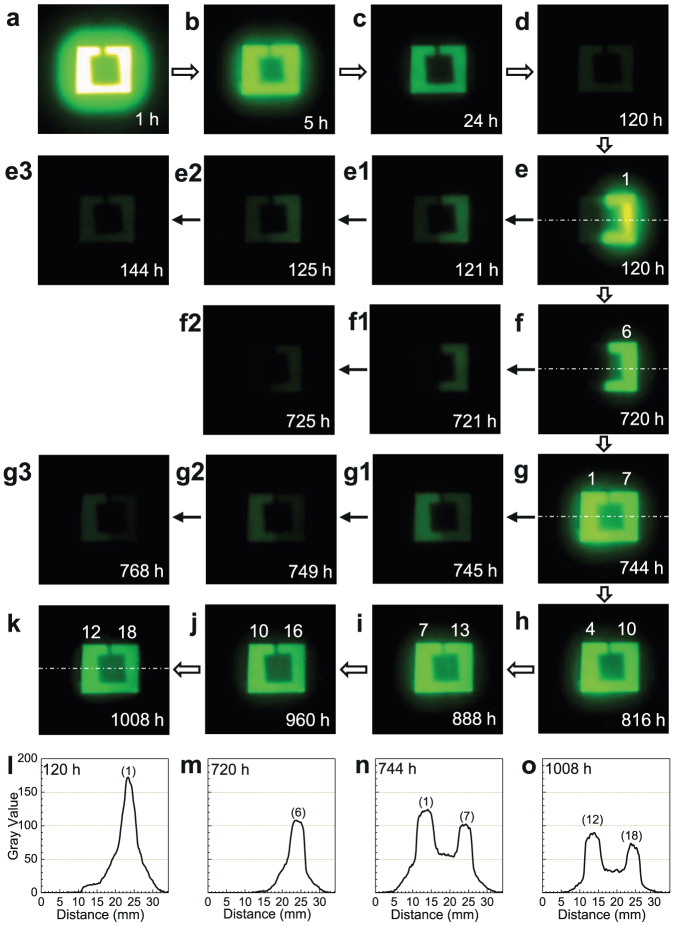
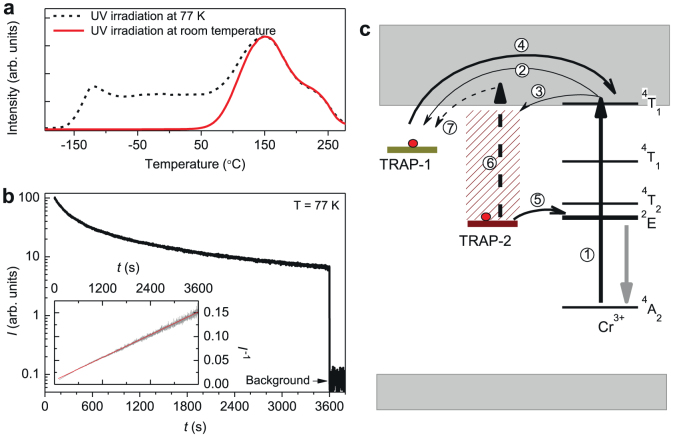
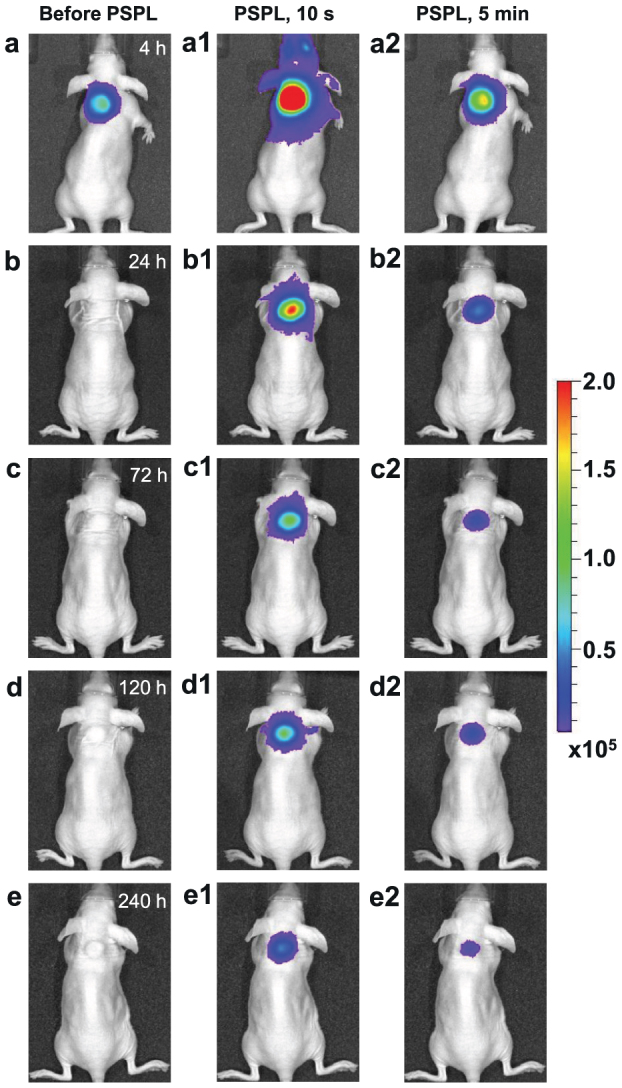
In conventional photostimulable storage phosphors, the optical information written by x-ray or ultraviolet irradiation is usually read out as a visible photostimulated luminescence (PSL) signal under the stimulation of a low-energy light with appropriate wavelength. Unlike the transient PSL, here we report a new optical read-out form, photostimulated persistent luminescence (PSPL) in the near-infrared (NIR), from a Cr(3+)-doped LiGa₅O₈ NIR persistent phosphor exhibiting a super-long NIR persistent luminescence of more than 1,000 h. An intense PSPL signal peaking at 716 nm can be repeatedly obtained in a period of more than 1,000 h when an ultraviolet-light (250-360 nm) pre-irradiated LiGa₅O₈:Cr(3+) phosphor is repeatedly stimulated with a visible light or a NIR light. The LiGa₅O₈:Cr(3+) phosphor has promising applications in optical information storage, night-vision surveillance, and in vivo bio-imaging.


Figures

Figure 1
Figure 1. Photoluminescence and persistent luminescence of LiGa5O8:Cr3+ phosphor discs at room temperature.
(a) Normalized excitation and emission spectra for photoluminescence. The emission spectrum is acquired under 400 nm light excitation and the excitation spectrum is obtained by monitoring 716 nm emission. (b) NIR persistent luminescence decay curve monitored at 716 nm after irradiation by 300 nm light for 20 min. The upper inset shows the persistent luminescence emission spectrum recorded at 1 h after the stoppage of the irradiation. The bottom inset is the persistent luminescence excitation spectrum obtained by plotting the persistent luminescence intensity (I10s) monitored at 716 nm as a function of the excitation wavelengths over the 250–600 nm spectral range. The disc was irradiated for 5 min at each measured wavelength using a xenon arc lamp. (c–j) NIR images of four phosphor discs taken at different persistent luminescence times (10 min to 1,080 h) after irradiated by a 254 nm lamp for 10 s to 5 min. The imaging parameters are: (c–f) manual/ISO 400/10 s, (g–i) manual/ISO 800/30 s, and (j) manual/ISO 1600/30 s.
Figure 2
Figure 2. UV-irradiation-induced coloration and changes in diffuse reflectance absorption of LiGa5O8:Cr3+ phosphor plates.
(a) Digital image of a 15 × 15 mm2 LiGa5O8:Cr3+ phosphor plate with its center covered by an 8 × 8 mm2 black paper in room light environment. Scale bar, 5 mm. (b) The same plate as the one in (a) after exposed to a 254 nm UV lamp for 5 min. The paper was removed after the irradiation. (c) Diffuse reflectance absorption spectra acquired on LiGa5O8:Cr3+ plates with and without UV irradiation. Curve 1 and curve 2 were recorded on a 300 nm-light-irradiated plate (for 20 min) with delay times of 10 s and 120 h, respectively. Curve 3 was acquired on a bleached plate (without UV pre-irradiation). The dash-line curve is the difference between curve 1 and curve 3. The dot-dash-line curve is the difference between curve 2 and curve 3.
Figure 3
Figure 3. Thermoluminescence spectra and PSPL decay curves of LiGa5O8:Cr3+ phosphor discs.
(a) Thermoluminescence curves monitored at 716 nm emission over 20–280°C. The samples were pre-irradiated by 300 nm UV light for 20 min. The dot-dash-line curve and solid-line curve were acquired at delay times of 10 s and 120 h, respectively. The dash-line curve was acquired on a 120 h-decayed disc after stimulation by 400 nm light for 100 s. (b) PSPL decay curves monitored at 716 nm. The brown curve was acquired on a 120 h-decayed disc (pre-irradiated by 300 nm light for 20 min), while the grey curve was recorded on a bleached disc (without UV pre-irradiation). The inset is the PSPL emission spectrum of the 120 h-decayed disc, which was recorded at 10 s after the stoppage of the stimulation. The wavelength of the stimulation light is 400 nm.
Figure 4
Figure 4. Optical write-in and read-out spectra for PSPL in LiGa5O8:Cr3+.
(a) Persistent luminescence decay curves monitored at 716 nm with (colored solid-line curves) and without (grey dash-line curves) photostimulation. The write-in wavelengths (λwi) are 320 nm, 340 nm and 360 nm. The read-out wavelength (λro) is 400 nm. (b) Persistent luminescence decay curves monitored at 716 nm with (colored solid-line curves) and without (grey dash-line curve) photostimulation. The write-in wavelength (λwi) is 300 nm. The read-out wavelengths (λro) vary between 380 nm and 660 nm. For the measurements in (a) and (b), the read-out process (i.e., stimulation) starts at 5 min after ceasing the write-in process (i.e., UV pre-irradiation). The vertical double arrowheads in (a) and (b) represent the PSPL intensities. (c), PSPL write-in spectrum (the ball curve in left panel) and read-out spectrum (the triangle curve in right panel) plotted according to the data from (a) and (b), respectively.
Figure 5
Figure 5. NIR images for PSPL in LiGa5O8:Cr3+ phosphor plate.
The plate is the same as the one in Fig. 2a. Before imaging the plate was exposed to a 254 nm UV lamp for 20 min. (a–d) Natural decay to 120 h at room temperature. (e–f) From 120 to 720 h, the right half of the plate was stimulated by a white LED for 20 s at every 120 h. (e1–e3) and (f1–f2) show the natural decay after each stimulation. (g–k) From 744 to 1,008 h, the entire plate was stimulated by a white LED for 20 s at every 24 h. (g1–g3) show the natural decay after the stimulation. All the PSPL images were taken at 10 s after ceasing the white LED stimulation. The numbers on the top of the bright square ring in (e–k) are the times of stimulation (i.e., read-out). The imaging parameter is manual/ISO 400/10 s. (i–o) Pixel intensity acquired along the white dot-dash lines in (e), (f), (g), and (k), respectively, by converting each pixel to grayscale using ImageJ software. The number on the top of each peak is the times of stimulation.
Figure 6
Figure 6. Low-temperature thermoluminescence and persistent luminescence measurements and NIR PSPL mechanisms in LiGa5O8:Cr3+.
(a) Thermoluminescence curves recorded by monitoring at 716 nm emission over −196–280°C (77–553 K) on a LiGa5O8:Cr3+ disc. The dash-line curve and solid-line curve were recorded after 300 nm UV light irradiations for 20 min at 77 K and at room temperature, respectively. (b) Persistent luminescence intensity (I) monitored at 716 nm as a function of time (t) at 77 K for a LiGa5O8:Cr3+ disc pre-irradiated at room temperature. Inset shows the same data plotted as I−1 versus t. (c) Schematic representation of the NIR persistent luminescence and photostimulated NIR persistent luminescence mechanisms. The straight-line arrows and curved-line arrows represent optical transition and electron transfer processes (see text for further detail), respectively.
Figure 7
Figure 7. Images of PEI-LiGa5O8:Cr3+ nanoparticles labeled 4T1 cells injected into a nude mouse for a 10-day tracking using an IVIS imaging system.
The PEI-LiGa5O8:Cr3+ nanoparticles labeled 4T1 cells (~2.5 × 10⁷ cells) were illuminated by a 4-W 254 nm UV lamp for 15 min, and then subcutaneously injected into the back of a nude mouse. (a) Image taken at 4 h after cell injection. To get the PSPL signal, the mouse was exposed to a white LED flashlight (Olight SR51, 900 lumens) for 15 s. (a1) and (a2), Images taken at 10 s and 5 min after the stimulation, respectively. The signals were attributed to PSPL. (b–e) The mouse was exposed daily to the LED flashlight for 15 s, and images were taken at 10 s and 5 min after the stimulation. All images were acquired in the bioluminescence mode with an exposure time of 2 min. The images were processed using Living Image software at binning of 4 and smooth of 5 × 5. The color scale bar represents the luminescence intensity in the unit of radiance, p/sec/cm2/sr.

References

    1. Yukihara E. G. & McKeever W. S. Optically Stimulated Luminescence: Fundamental and Applications (John Wiley & Sons Ltd., 2011).
    1. Schweizer S. Physics and current understanding of x-ray storage phosphors. Phys. Stat. Sol. (a) 187, 335–393 (2001).
    1. Brito H. F. et al. Persistent luminescence mechanism: human imagination at work. Opt. Mater. Express 2, 371–381 (2012).
    1. Hölsä J. Persistent luminescence beats the afterglow: 400 years of persistent luminescence. Electrochem. Soc. Interface 18, 42–45 (2009).
    1. van den Eeckhout K., Smet P. F. & Poelman D. Persistent luminescence in Eu2+-doped compounds: a review. Materials 3, 2536–2566 (2010). - PMC - PubMed

Publication types