. 2013 Mar 26:4:65.
doi: 10.3389/fimmu.2013.00065. eCollection 2013.

Natural killer cell inhibitory receptor expression in humans and mice: a closer look

Affiliations

Natural killer cell inhibitory receptor expression in humans and mice: a closer look

Michal Sternberg-Simon et al. Front Immunol. .

Abstract

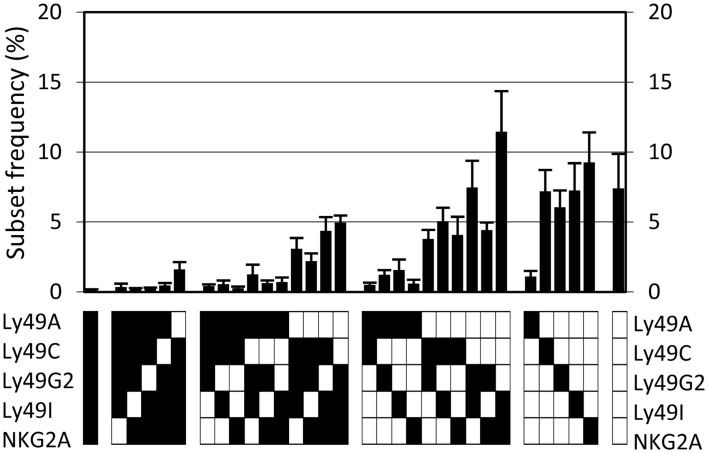
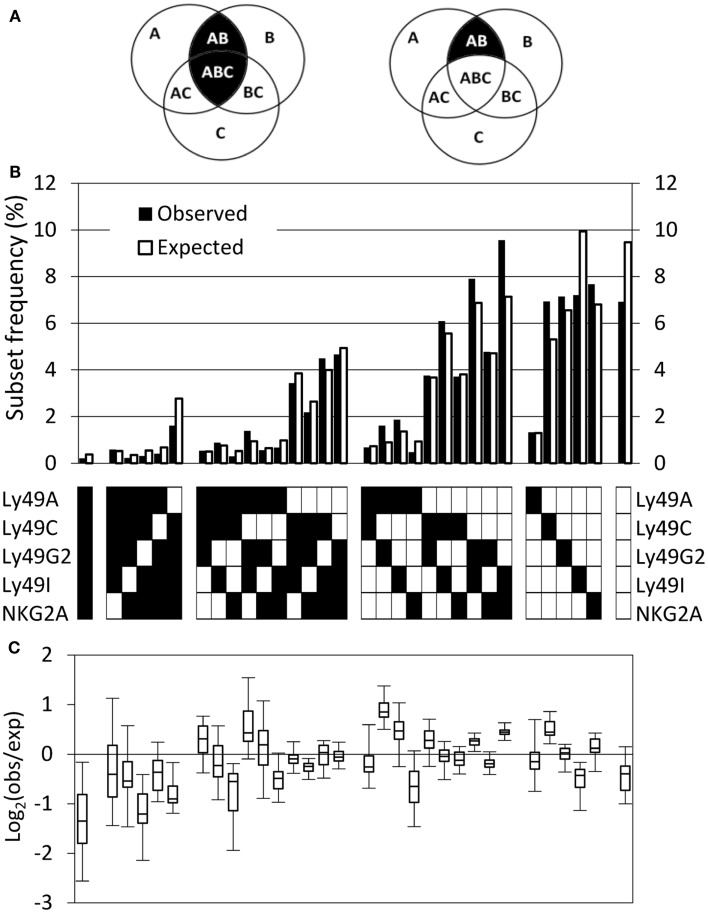
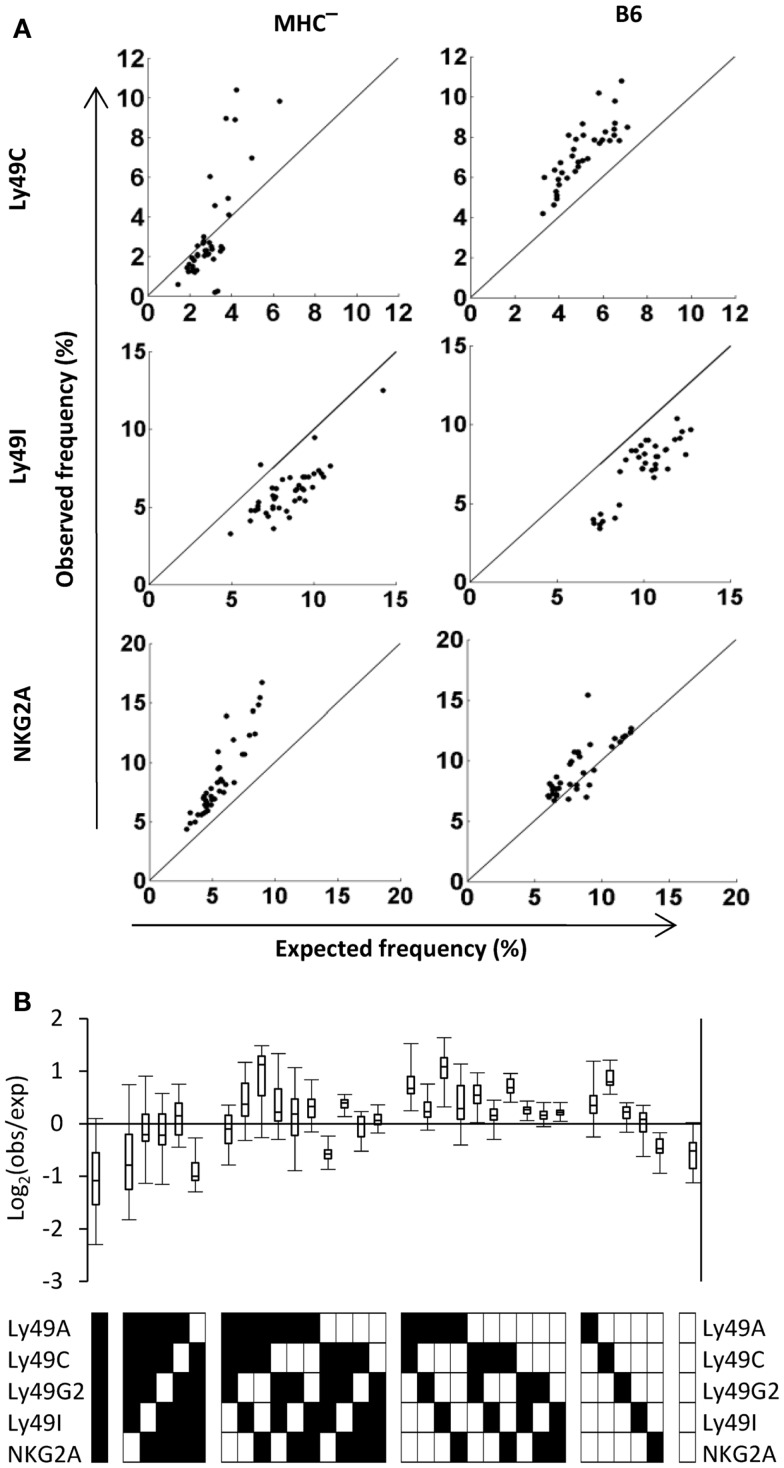
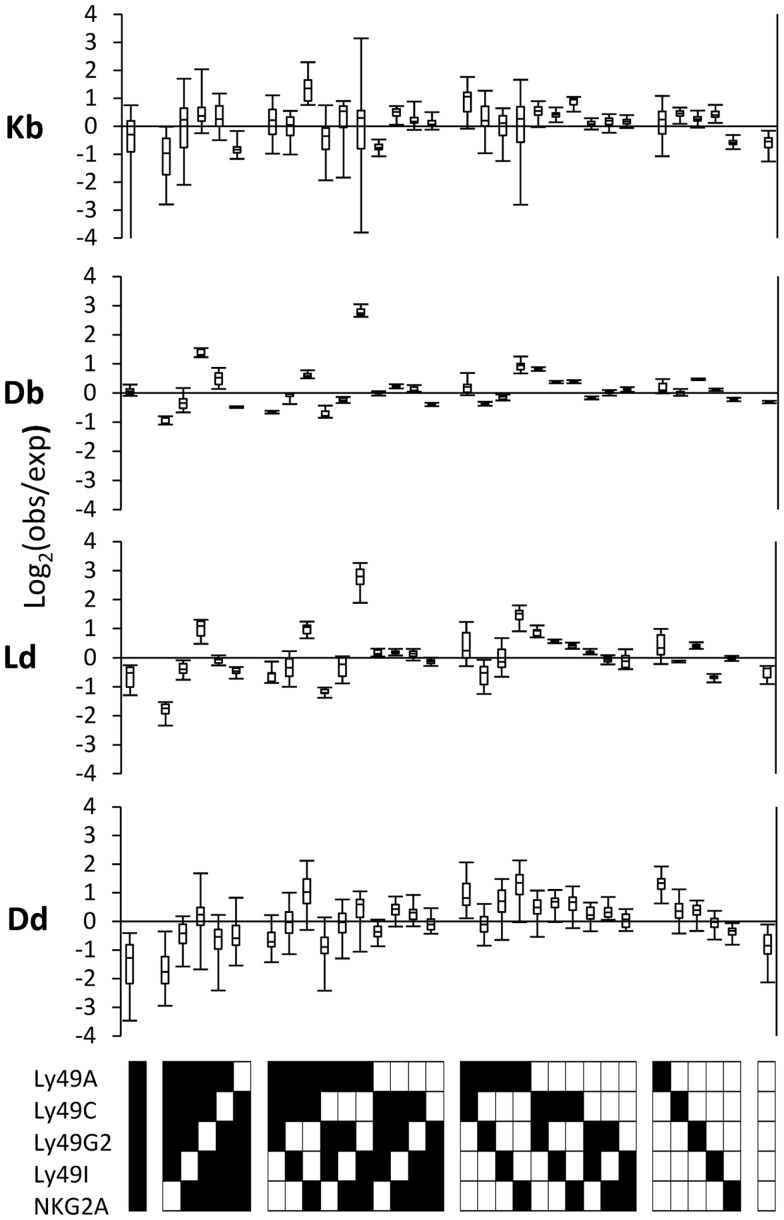
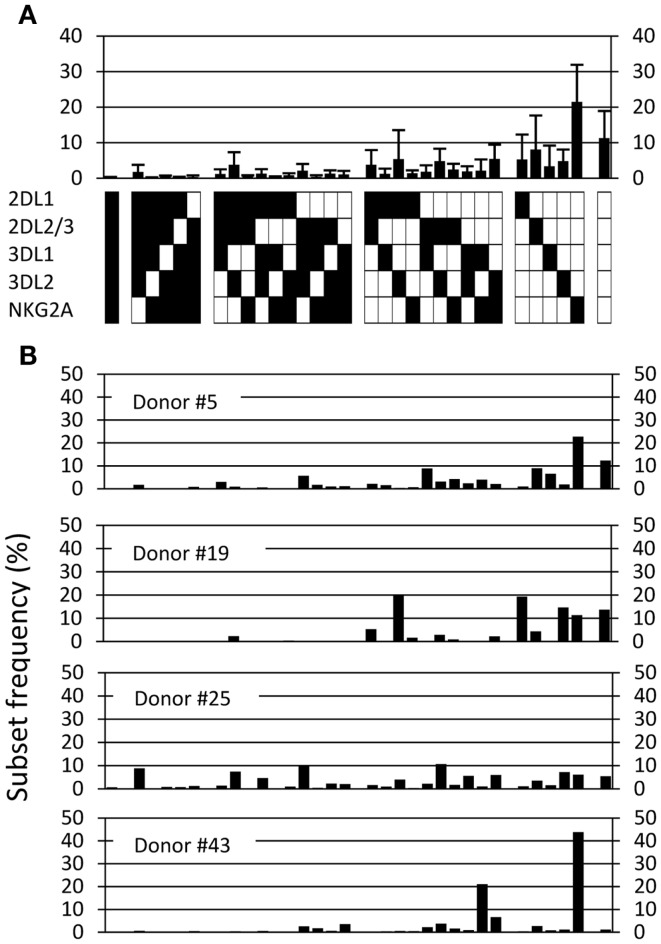
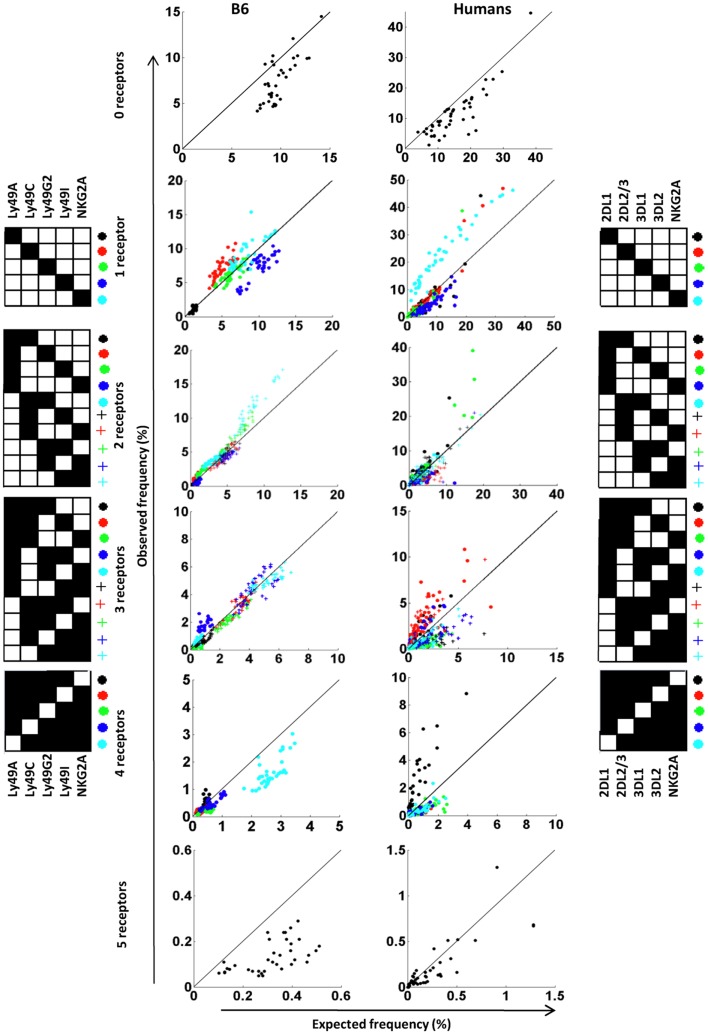
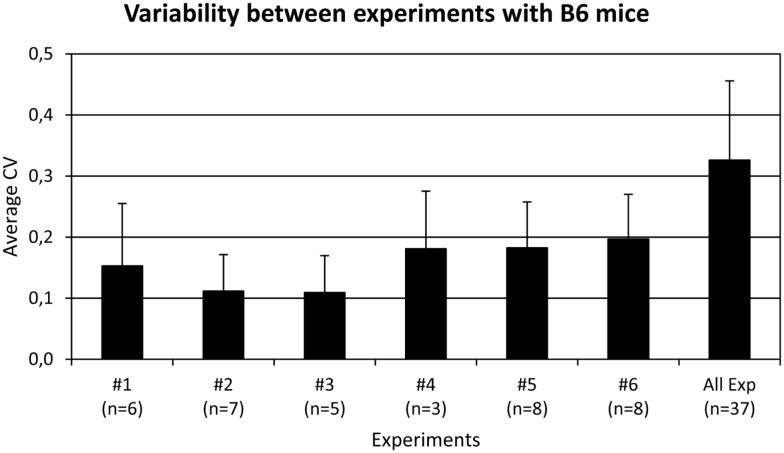
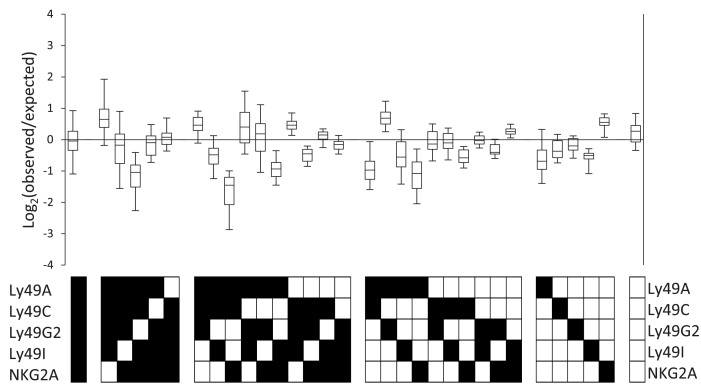
The Natural Killer (NK) cell population is composed of subsets of varying sizes expressing different combinations of inhibitory receptors for MHC class I molecules. Genes within the NK gene complex, including the inhibitory receptors themselves, seem to be the primary intrinsic regulators of inhibitory receptor expression, but the MHC class I background is an additional Modulating factor. In this paper, we have performed a parallel study of the inhibitory receptor repertoire in inbred mice of the C57Bl/6 background and in a cohort of 44 humans. Deviations of subset frequencies from the "product rule (PR)," i.e., differences between observed and expected frequencies of NK cells, were used to identify MHC-independent and MHC-dependent control of receptor expression frequencies. Some deviations from the PR were similar in mice and humans, such as the decreased presence of NK cell subset lacking inhibitory receptors. Others were different, including a role for NKG2A in determining over- or under-representation of specific subsets in humans but not in mice. Thus, while human and murine inhibitory receptor repertoires differed in details, there may also be shared principles governing NK cell repertoire formation in these two species.

Keywords: Ly49; MHC class I; killer immunoglobulin-like receptor; product rule; repertoire.


Figures

Figure 1
Figure 1
The NK cell inhibitory receptor repertoire in B6 mice. The observed frequency of each of 32 possible combinations, averaged for 37 mice, analyzed in six independent experiments. Error bars indicate the standard deviations. The lower panel indicates, for each combination, whether an individual receptor is expressed in this combination or not (black and white squares, respectively).
Figure 2
Figure 2
The observed repertoire in B6 mice deviates from the product rule. (A) The inclusive (left) and exclusive (right) calculation of the probability to express two out of three possible receptors. If the probability to express each of the receptors A, B, and C is P(A), P(B), and P(C), respectively, then the inclusive probability to express A and B is P(AB) = P(A) × P(B) and it includes all the cells that expresses both A and B, regardless to the expression of C, and therefore includes combinations AB and ABC. The exclusive probability to express A and B is P(AB) = P(A) × P(B) × [1−P(C)], and it includes only cells that express A and B, but do not express C. (B) The observed (black bars) and expected (white bars) repertoire of one representative mouse. (C) Deviations from the product rule in 37 B6 mice, shown as box plots of log2 (observed frequency/expected frequency). Negative values indicate that the respective combination is under-expressed, compared to the expected frequency, and positive values indicate over-expression.
Figure 3
Figure 3
Deviations from the product rule of single receptor combinations in B6 and MHC mice. (A) The observed frequencies of NK cells expressing the indicated single receptor combination in 43 MHC and 37 B6 mice (left and right panel, respectively) are plotted against the expected frequency, under the product rule assumption. A perfect fit to the product rule is shown as a straight line. (B) Deviations from the product rule in 37 B6 mice, after subtracting, for each mouse and for each receptor combination, the average deviation measured in 43 MHC mice for the same combination.
Figure 4
Figure 4
MHC-dependent deviations from the product rule in single MHC mice. The deviations from the product rule of 37 Kb mice, 6 Db mice, 6 Ld mice, and 34 Dd mice, after subtracting, for each mouse and each receptor combination, the average deviation observed in 43 MHC mice for the same combination.
Figure 5
Figure 5
The human repertoire is highly diverse. (A) The observed frequency of each of 32 possible combinations, averaged for 44 haplotype A donors. Error bars indicate the standard deviation. (B) The observed repertoires in four individual haplotype A donors.
Figure 6
Figure 6
Deviations from the product rule in B6 mice and in humans. The observed frequency of NK cells co-expressing zero to five receptor combinations are plotted against the expected frequency, in 37 B6 mice (left panel) and 44 A haplotype human donors (right panel). A perfect fit to the product rule is shown as a straight line. Each symbol indicates a specific receptor combination, as shown on the panels beside the figures.
Figure A1
Figure A1
Repertoire variations in each experiment separately (#1–#6) and in all mice together (All Exp). The average frequencies of each of the 32 NK cell subsets were first calculated in each group of mice. The coefficient of variance (CV, standard deviation/average) for each subset was determined and the average of all subsets in each group was plotted with the standard deviation. The number of mice in each experiment is indicated in parentheses. The CV’s were (from left to right): 015, 0.11, 0.109, 0.181, 0.182, 0.2, and 0.33. The higher the CV, the higher the variation is in the group.
Figure A2
Figure A2
Deviations from the product rule in 43 MHC-deficient mice, shown as box plots of log2 (observed frequency/expected frequency). Negative values indicate that the respective combination is under-expressed, compared to the expected frequency, and positive values indicate over-expression.

Similar articles

Cited by

References

    1. Achour A., Persson K., Harris R. A., Sundback J., Sentman C. L., Lindqvist Y., et al. (1998). The crystal structure of H-2Dd MHC class I complexed with the HIV-1-derived peptide P18-I10 at 2.4 A resolution: implications for T cell and NK cell recognition. Immunity 9, 199–20810.1016/S1074-7613(00)80602-0 - DOI - PubMed
    1. Andersson K. E., Williams G. S., Davis D. M., Hoglund P. (2007). Quantifying the reduction in accessibility of the inhibitory NK cell receptor Ly49A caused by binding MHC class I proteins in cis. Eur. J. Immunol. 37, 516–52710.1002/eji.200636562 - DOI - PubMed
    1. Andersson S., Fauriat C., Malmberg J. A., Ljunggren H. G., Malmberg K. J. (2009). KIR acquisition probabilities are independent of self-HLA class I ligands and increase with cellular KIR expression. Blood 114, 95–10410.1182/blood-2009-08-239301 - DOI - PubMed
    1. Andrews D. M., Sullivan L. C., Baschuk N., Chan C. J., Berry R., Cotterell C. L., et al. (2012). Recognition of the nonclassical MHC class I molecule H2-M3 by the receptor Ly49A regulates the licensing and activation of NK cells. Nat. Immunol. 13, 1171–117710.1038/ni.2468 - DOI - PMC - PubMed
    1. Anfossi N., Andre P., Guia S., Falk C. S., Roetynck S., Stewart C. A., et al. (2006). Human NK cell education by inhibitory receptors for MHC class I. Immunity 25, 331–34210.1016/j.immuni.2006.06.013 - DOI - PubMed