Evaluation of target dose based on water-equivalent thickness in external beam radiotherapy
- PMID: 23532059
- PMCID: PMC3607346
- DOI: 10.4103/0971-6203.106605
Evaluation of target dose based on water-equivalent thickness in external beam radiotherapy
Abstract
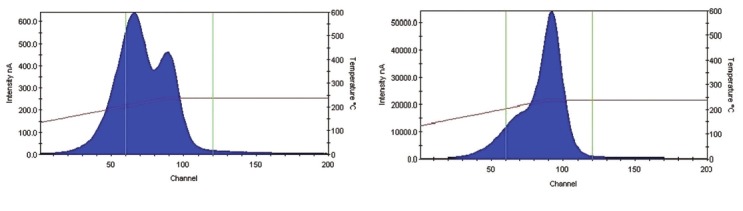
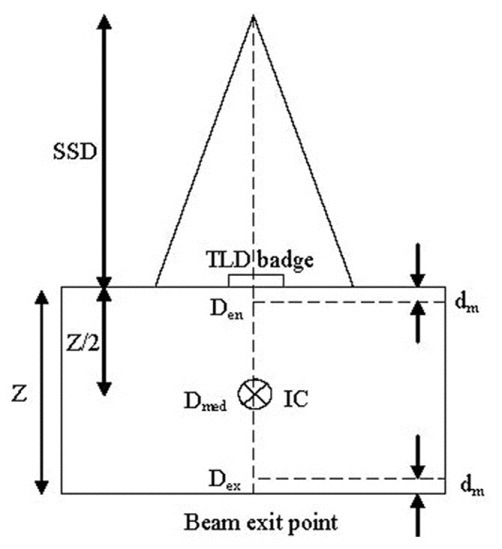
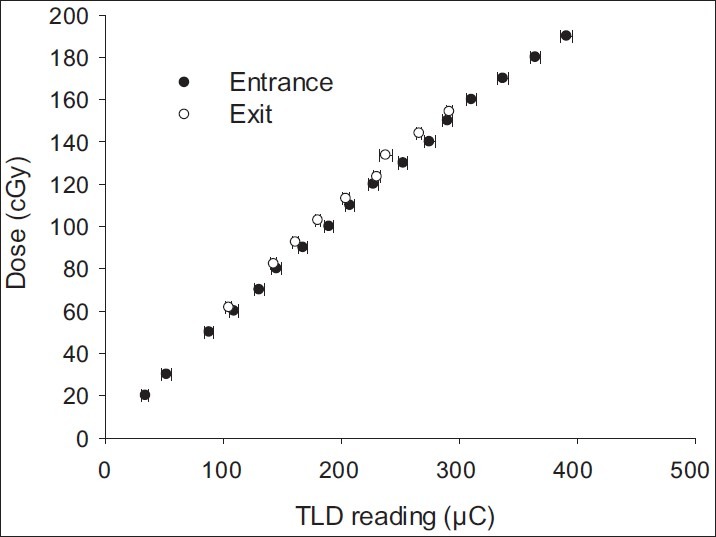
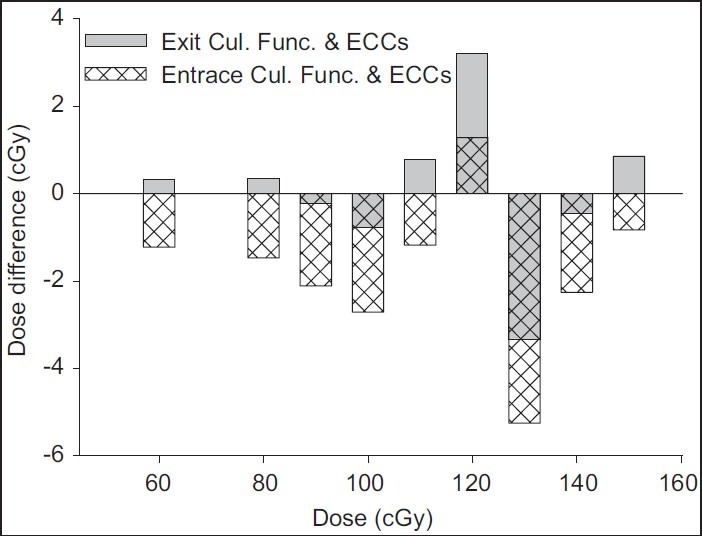
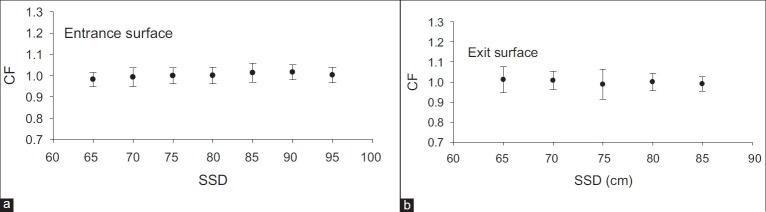
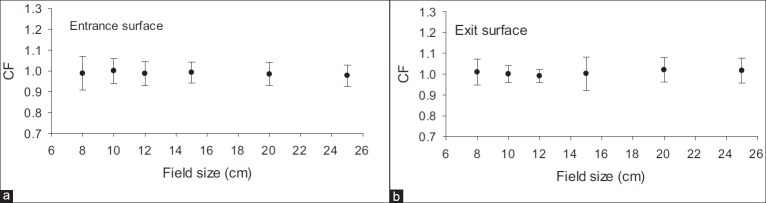
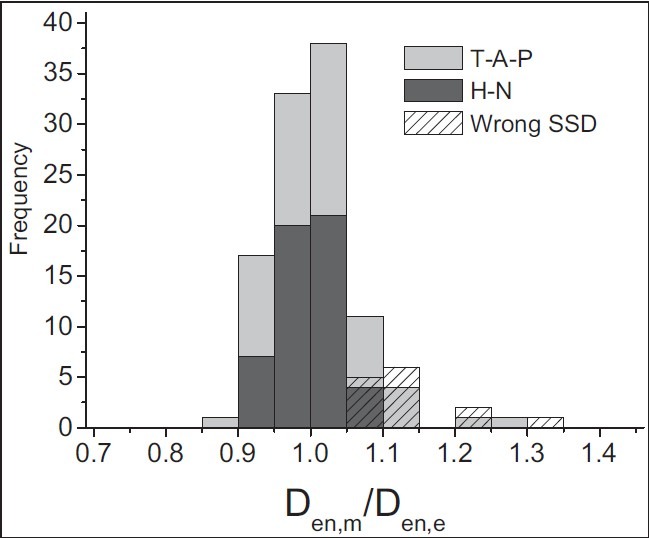
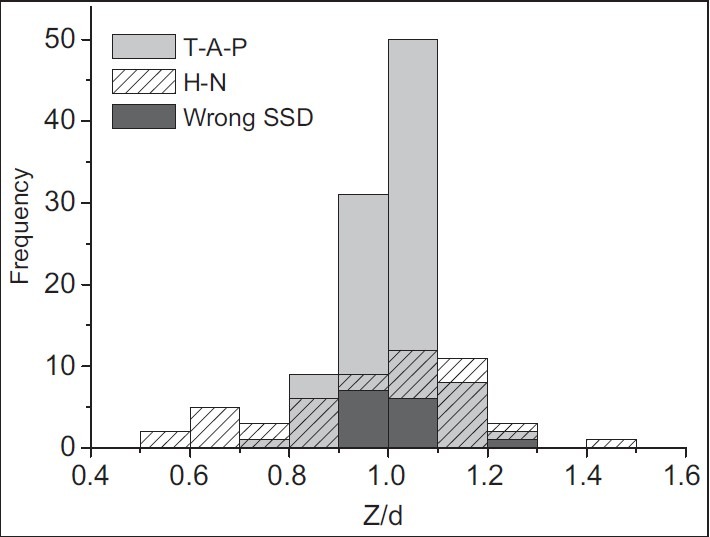
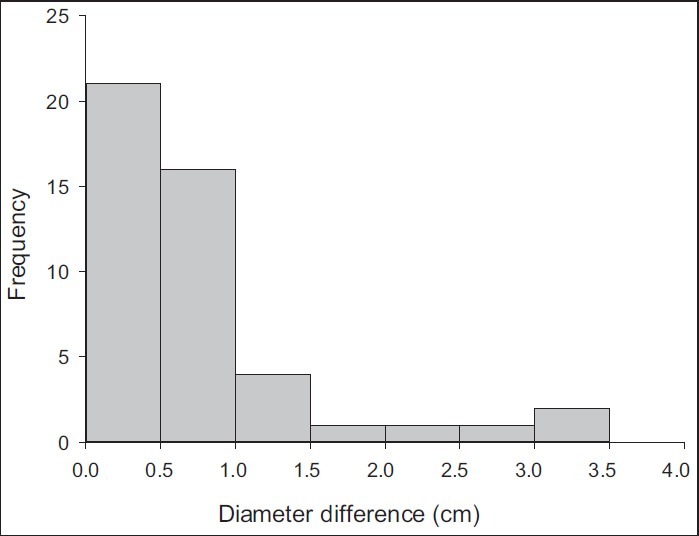
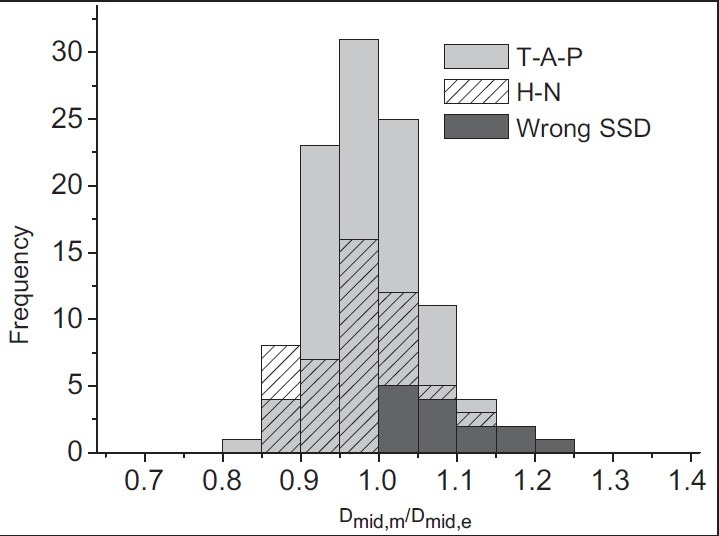
In vivo dosimetry was carried out for 152 patients receiving external beam radiotherapy and the treatment sites were divided into two main groups: Thorax, Abdomen, and Pelvic (120 fields) and Head and Neck (52 fields). Combined entrance and exit dose measurements were performed using LiF: Mg, Cu, P thermoluminescent dosimeters (TLDs). Water-equivalent (effective) thicknesses and target dose were evaluated using dose transmission data. The ratio of measured to expected value for each quantity was considered as an indicator for the accuracy of the parameter. The average ratio of the entrance dose was evaluated as 1.01 ± 0.07. In the diameter measurement, the mean ratio of effective depth divided by the contour depth is 1.00 ± 0.13 that shows a wide distribution which reflects the influence of contour inaccuracies as well as tissue inhomogeneities. At the target level, the mean ratio of measured to the prescribed dose is 1.00 ± 0.07. According to our findings, the difference between effective depth and patient depth has a direct relation to target dose discrepancies. There are some inevitable sources which may cause the difference. Evaluation and application of effective diameter in treatment calculations would lead to a more reliable target dose, especially for fields which involve Thorax, Abdomen, and Pelvic.
Keywords: External beam radiotherapy; in vivo do simetry; target dose; thermoluminescent dosimetry.
Conflict of interest statement
Figures
Similar articles
-
Entrance dose measurement: a simple and reliable technique.Med Dosim. 2003 Summer;28(2):73-8. doi: 10.1016/S0958-3947(02)00236-4. Med Dosim. 2003. PMID: 12804703
-
Clinical use of carbon-loaded thermoluminescent dosimeters for skin dose determination.Int J Radiat Oncol Biol Phys. 1995 Nov 1;33(4):943-50. doi: 10.1016/0360-3016(95)00274-4. Int J Radiat Oncol Biol Phys. 1995. PMID: 7591907
-
Quality assurance in radiotherapy by in vivo dosimetry. 2. Determination of the target absorbed dose.Radiother Oncol. 1990 Sep;19(1):73-87. doi: 10.1016/0167-8140(90)90167-u. Radiother Oncol. 1990. PMID: 2236639
-
Whole-body dose and energy measurements in radiotherapy by a combination of LiF:Mg,Cu,P and LiF:Mg,Ti.Z Med Phys. 2018 Apr;28(2):96-109. doi: 10.1016/j.zemedi.2017.07.002. Epub 2017 Aug 12. Z Med Phys. 2018. PMID: 28807441
-
Entrance and exit dose measurements with semiconductors and thermoluminescent dosemeters: a comparison of methods and in vivo results.Radiother Oncol. 1996 Nov;41(2):179-87. doi: 10.1016/s0167-8140(96)01826-9. Radiother Oncol. 1996. PMID: 9004362
Cited by
-
Radioluminescence characterization of in situ x-ray nanodosimeters: Potential real-time monitors and modulators of external beam radiation therapy.Appl Phys Lett. 2014 Nov 17;105(20):203110. doi: 10.1063/1.4900962. Epub 2014 Nov 20. Appl Phys Lett. 2014. PMID: 25425747 Free PMC article.
-
Assessment of olfactory threshold in patients undergoing radiotherapy for head and neck malignancies.Iran J Otorhinolaryngol. 2014 Oct;26(77):211-7. Iran J Otorhinolaryngol. 2014. PMID: 25320698 Free PMC article.
References
-
- Leunens G, Van Dam J, Dutreix A, van der Schueren E. Quality assurance in radiotherapy by in vivo dosimetry. 1. Entrance dose measurements, a reliable procedure. Radiother Oncol. 1990;17:141–51. - PubMed
-
- Leunens G, Van Dam J, Dutreix A, van der Schueren E. Quality assurance in radiotherapy by in vivo dosimetry. 2. Determination of the target absorbed dose. Radiother Oncol. 1990;19:73–87. - PubMed
-
- Adeyemi A, Lord J. An audit of radiotherapy patient doses measured with in vivo semiconductor detectors. Br J Radiol. 1997;70:399–408. - PubMed
-
- Fiorino C, Corletto D, Mangili P, Broggi S, Bonini A, Cattaneo GM, et al. Quality assurance by systematic in vivo dosimetry: Results on a large cohort of patients. Radiother Oncol. 2000;56:85–95. - PubMed
-
- Herbert CE, Ebert MA, Joseph DJ. Feasible measurement errors with undertaking in vivo dosimetry during external beam radiotherapy of the breast. Med Dosim. 2003;28:45–8. - PubMed
LinkOut - more resources
Full Text Sources
Other Literature Sources