Regulation of Arabidopsis leaf hydraulics involves light-dependent phosphorylation of aquaporins in veins
- PMID: 23532070
- PMCID: PMC3634675
- DOI: 10.1105/tpc.112.108456
Regulation of Arabidopsis leaf hydraulics involves light-dependent phosphorylation of aquaporins in veins
Abstract
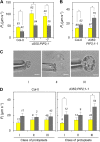
The water status of plant leaves depends on the efficiency of the water supply, from the vasculature to inner tissues. This process is under hormonal and environmental regulation and involves aquaporin water channels. In Arabidopsis thaliana, the rosette hydraulic conductivity (Kros) is higher in darkness than it is during the day. Knockout plants showed that three plasma membrane intrinsic proteins (PIPs) sharing expression in veins (PIP1;2, PIP2;1, and PIP2;6) contribute to rosette water transport, and PIP2;1 can fully account for Kros responsiveness to darkness. Directed expression of PIP2;1 in veins of a pip2;1 mutant was sufficient to restore Kros. In addition, a positive correlation, in both wild-type and PIP2;1-overexpressing plants, was found between Kros and the osmotic water permeability of protoplasts from the veins but not from the mesophyll. Thus, living cells in veins form a major hydraulic resistance in leaves. Quantitative proteomic analyses showed that light-dependent regulation of Kros is linked to diphosphorylation of PIP2;1 at Ser-280 and Ser-283. Expression in pip2;1 of phosphomimetic and phosphorylation-deficient forms of PIP2;1 demonstrated that phosphorylation at these two sites is necessary for Kros enhancement under darkness. These findings establish how regulation of a single aquaporin isoform in leaf veins critically determines leaf hydraulics.
Figures


Similar articles
-
A PIP1 aquaporin contributes to hydrostatic pressure-induced water transport in both the root and rosette of Arabidopsis.Plant Physiol. 2010 Mar;152(3):1418-30. doi: 10.1104/pp.109.145326. Epub 2009 Dec 24. Plant Physiol. 2010. PMID: 20034965 Free PMC article.
-
Phosphorylation of plasma membrane aquaporin PIP2;1 in C-terminal affects light-induced stomatal opening in Arabidopsis.Plant Signal Behav. 2020 Oct 2;15(10):1795394. doi: 10.1080/15592324.2020.1795394. Epub 2020 Jul 21. Plant Signal Behav. 2020. PMID: 32693667 Free PMC article.
-
Overexpression of PIP2;5 aquaporin alleviates effects of low root temperature on cell hydraulic conductivity and growth in Arabidopsis.Plant Physiol. 2012 May;159(1):479-88. doi: 10.1104/pp.112.194506. Epub 2012 Mar 20. Plant Physiol. 2012. PMID: 22434042 Free PMC article.
-
PIP1 aquaporins: Intrinsic water channels or PIP2 aquaporin modulators?FEBS Lett. 2015 Nov 30;589(23):3508-15. doi: 10.1016/j.febslet.2015.10.018. Epub 2015 Oct 23. FEBS Lett. 2015. PMID: 26526614 Review.
-
Carbon dioxide and water transport through plant aquaporins.Plant Cell Environ. 2017 Jun;40(6):938-961. doi: 10.1111/pce.12844. Epub 2016 Dec 1. Plant Cell Environ. 2017. PMID: 27739588 Review.
Cited by
-
Phosphoproteomics technologies and applications in plant biology research.Front Plant Sci. 2015 Jun 16;6:430. doi: 10.3389/fpls.2015.00430. eCollection 2015. Front Plant Sci. 2015. PMID: 26136758 Free PMC article. Review.
-
Membrane water permeability of maize root cells under two levels of oxidative stress.Protoplasma. 2015 Sep;252(5):1263-73. doi: 10.1007/s00709-015-0758-9. Epub 2015 Jan 18. Protoplasma. 2015. PMID: 25596933
-
Aquaporins: highly regulated channels controlling plant water relations.Plant Physiol. 2014 Apr;164(4):1600-18. doi: 10.1104/pp.113.233791. Epub 2014 Jan 21. Plant Physiol. 2014. PMID: 24449709 Free PMC article. Review.
-
Arabidopsis MSL10 has a regulated cell death signaling activity that is separable from its mechanosensitive ion channel activity.Plant Cell. 2014 Jul;26(7):3115-31. doi: 10.1105/tpc.114.128082. Epub 2014 Jul 22. Plant Cell. 2014. PMID: 25052715 Free PMC article.
-
Genome-Wide Identification and Gene Expression Analysis of Sweet Cherry Aquaporins (Prunus avium L.) under Abiotic Stresses.Genes (Basel). 2023 Apr 19;14(4):940. doi: 10.3390/genes14040940. Genes (Basel). 2023. PMID: 37107698 Free PMC article.
References
-
- Ache P., Bauer H., Kollist H., Al-Rasheid K.A., Lautner S., Hartung W., Hedrich R. (2010). Stomatal action directly feeds back on leaf turgor: New insights into the regulation of the plant water status from non-invasive pressure probe measurements. Plant J. 62: 1072–1082 - PubMed
-
- Alexandersson E., Fraysse L., Sjövall-Larsen S., Gustavsson S., Fellert M., Karlsson M., Johanson U., Kjellbom P. (2005). Whole gene family expression and drought stress regulation of aquaporins. Plant Mol. Biol. 59: 469–484 - PubMed
-
- Clough S.J., Bent A.F. (1998). Floral dip: A simplified method for Agrobacterium-mediated transformation of Arabidopsis thaliana. Plant J. 16: 735–743 - PubMed
Publication types
MeSH terms
Substances
LinkOut - more resources
Full Text Sources
Other Literature Sources
Molecular Biology Databases

