. 2013 Mar 26;6(268):ra20.
doi: 10.1126/scisignal.2003483.

PUMA and BIM are required for oncogene inactivation-induced apoptosis

Affiliations

PUMA and BIM are required for oncogene inactivation-induced apoptosis

Gregory R Bean et al. Sci Signal. .

Abstract

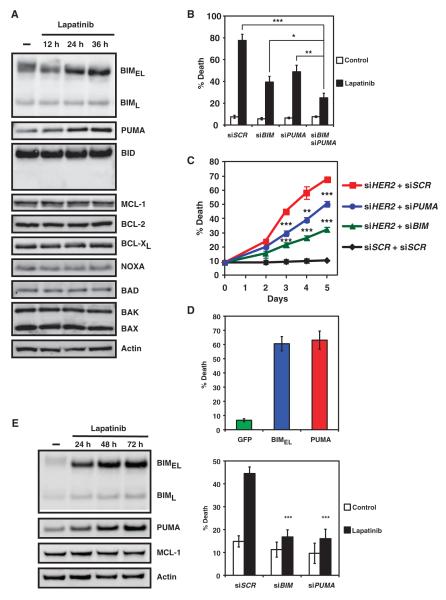
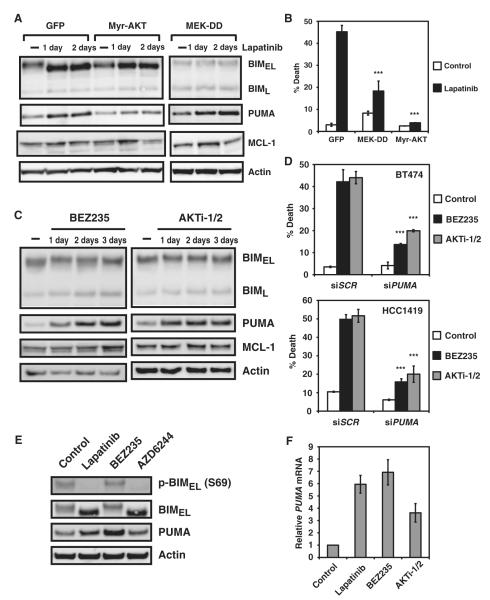
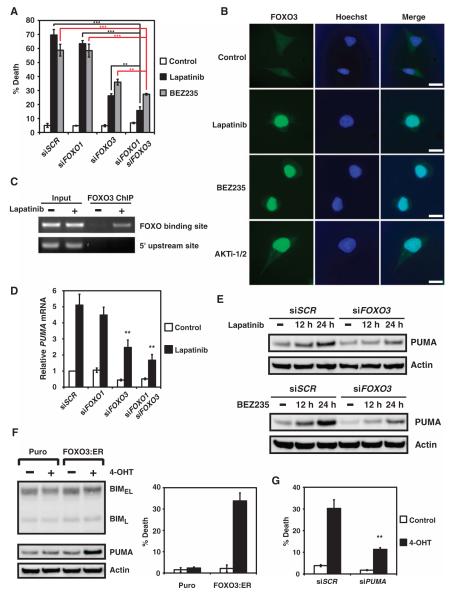
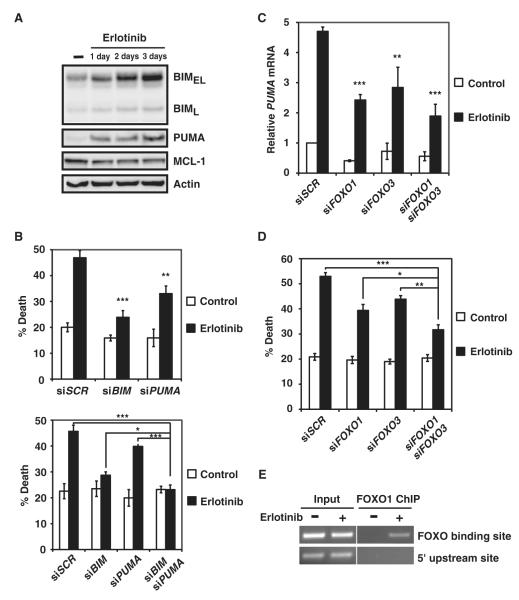
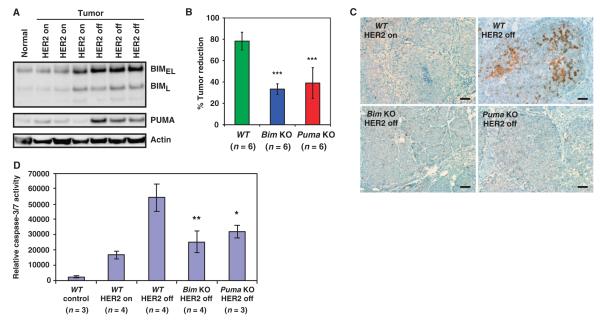
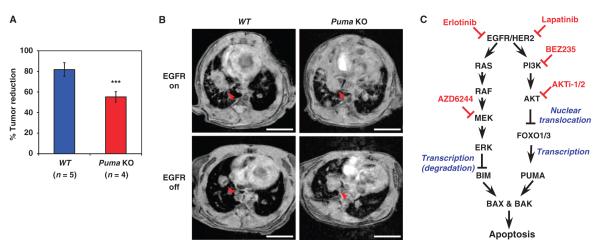
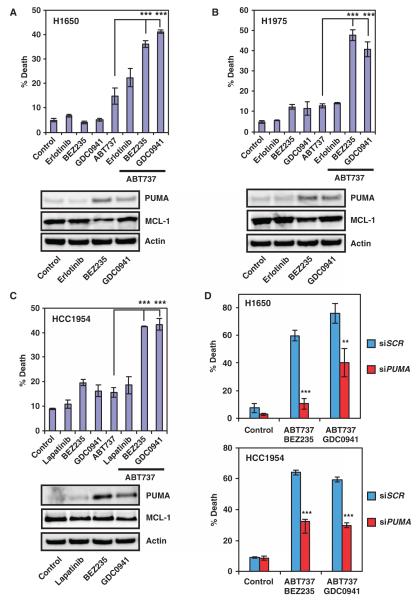
The clinical efficacy of tyrosine kinase inhibitors supports the dependence of distinct subsets of cancers on specific driver mutations for survival, a phenomenon called "oncogene addiction." We demonstrate that PUMA and BIM are the key apoptotic effectors of tyrosine kinase inhibitors in breast cancers with amplification of the gene encoding human epidermal growth factor receptor 2 (HER2) and lung cancers with epidermal growth factor receptor (EGFR) mutants. The BH3 domain containing proteins BIM and PUMA can directly activate the proapoptotic proteins BAX and BAK to permeabilize mitochondria, leading to caspase activation and apoptosis. We delineated the signal transduction pathways leading to the induction of BIM and PUMA by tyrosine kinase inhibitors. Inhibition of the mitogen-activated or extracellular signal-regulated protein kinase kinase (MEK)-extracellular signal-regulated kinase (ERK) pathway caused increased abundance of BIM, whereas antagonizing the phosphoinositide 3-kinase (PI3K)-AKT pathway triggered nuclear translocation of the FOXO transcription factors, which directly activated the PUMA promoter. In a mouse breast tumor model, the abundance of PUMA and BIM was increased after inactivation of HER2. Moreover, deficiency of Bim or Puma impaired caspase activation and reduced tumor regression caused by inactivation of HER2. Similarly, deficiency of Puma impeded the regression of EGFR(L858R)-driven mouse lung tumors upon inactivation of the EGFR-activating mutant. Overall, our study identified PUMA and BIM as the sentinels that interconnect kinase signaling networks and the mitochondrion-dependent apoptotic program, which offers therapeutic insights for designing novel cell death mechanism-based anticancer strategies.


Figures

Fig. 1
Fig. 1
BIM and PUMA are required for lapatinib-induced apoptosis of HER2-amplified breast cancer cells. (A) BT474 cells, mock-treated or treated with lapatinib (0.5 μM), were immunoblotted with the indicated antibodies (n = 3 independent experiments). (B) Quantification of cell death by fluorescence-activated cell sorting (FACS) analysis following annexin V staining of BT474 cells transfected with scramble siRNA (siSCR) or siRNA against BIM and/or PUMA and left untreated or treated with lapatinib. Data are mean percentages of annexin V–positive cells ± SD from three independent experiments. *P < 0.05; **P < 0.01; ***P < 0.001. (C) Quantification of cell death by FACS analysis following propidium iodide staining of BT474 cells transfected with scramble siRNA (siSCR) or siRNA against BIM or PUMA in combination with siRNA against HER2. Data are mean percentages of propidium iodide–positive cells ± SD from three independent experiments. **P < 0.01; ***P < 0.001. (D) BT474 cells were infected with retrovirus expressing green fluorescent protein (GFP), BIMEL, or PUMA, and cell death was quantified by FACS analysis following propidium iodide staining. Data are mean percentages of propidium iodide–positive cells ± SD from three independent experiments. (E) HCC1419 cells, untreated or treated with lapatinib (1 μM), were immunoblotted with the indicated antibodies (left panel, n = 3 independent experiments). Cell death was quantified by FACS analysis after propidium iodide staining after lapatinib treatment (right panel). Data are mean percentages of propidium iodide–positive cells ± SD from three independent experiments. ***P < 0.001.
Fig. 2
Fig. 2
Inhibition of the MEK-ERK pathway induces BIM, whereas blockade of the PI3K-AKT pathway induces PUMA. (A) BT474 cells stably expressing GFP, Myr-AKT, or a constitutively active mutant of MEK (MEK-DD) were untreated or treated with lapatinib and immunoblotted with the indicated antibodies (n = 2 independent experiments). (B) Quantification of cell death by FACS analysis after propidium iodide staining of BT474 cells stably expressing GFP, Myr-AKT, or a constitutively active mutant of MEK (MEK-DD) that were untreated or treated with lapatinib. Data are mean percentages of propidium iodide–positive cells ± SD from three independent experiments. ***P < 0.001. (C) BT474 cells, untreated or treated with BEZ235 or AKTi-1/2, were immunoblotted with the indicated antibodies (n = 2 independent experiments). (D) Quantification of cell death by FACS analysis after annexin V staining of BT474 cells or propidium iodide staining of HCC1419 cells transfected with scramble siRNA (siSCR) or siRNA against PUMA and left untreated or treated with BEZ235 or AKTi-1/2. Data are mean percentages of annexin V– or propidium iodide–positive cells ± SD from three independent experiments. ***P < 0.001. (E) BT474 cells were untreated or treated with lapatinib, BEZ235, or AZD6244 and immunoblotted with the indicated antibodies (n = 2 independent experiments). (F) PUMA mRNA abundance was assessed in BT474 cells untreated or treated with lapatinib, BEZ235, or AKTi-1/2. Data are normalized against glyceraldehyde-3-phosphate dehydrogenase (GAPDH) and presented as means ± SD of three independent experiments.
Fig. 3
Fig. 3
Inhibition of PI3K-AKT triggers nuclear translocation of FOXO and transactivation of PUMA. (A) Quantification of cell death by FACS analysis after annexin V staining of BT474 cells transfected with scramble siRNA (siSCR) or siRNAs against FOXO1, FOXO3, or both and left untreated or treated with lapatinib or BEZ235. Data are mean percentages of annexin V–positive cells ± SD from three independent experiments. **P < 0.01; ***P < 0.001. (B) Fluorescence microscopy of BT474 cells untreated or treated with lapatinib, BEZ235, or AKTi-1/2. Green, FOXO3; blue, Hoechst staining of DNA (n = 2 independent experiments). Scale bars, 25 μm. (C) BT474 cells, untreated or treated with lapatinib, were subjected to ChIP with the anti-FOXO3 antibody, followed by polymerase chain reaction (PCR) amplification of the PUMA promoter. A 5′ sequence located 4 kb upstream of the transcription start site of PUMA served as a negative control (n = 2 independent experiments). (D) PUMA mRNA abundance was assessed in BT474 cells that were transfected with scramble siRNA (siSCR) or siRNA against FOXO1 and/or FOXO3 and left untreated or treated with lapatinib. Data are normalized against GAPDH and are means ± SD of three independent experiments. **P < 0.01. (E) BT474 cells, transfected with scramble siRNA (siSCR) or siRNA against FOXO3, were untreated or treated with lapatinib or BEZ235 and immunoblotted with the indicated antibodies (n = 2 independent experiments). (F) Immunoblot analysis of BT474 stable cell lines that were generated with a control retrovirus (puro) or a retrovirus expressing a 4-OHT–inducible, constitutively active mutant of FOXO3 (FOXO3:ER) (left panel). Cell death was quantified by FACS analysis after annexin V staining (right panel). Data are mean percentages of annexin V–positive cells ± SD from three independent experiments. (G) Cell death was quantified by FACS analysis after annexin V staining in BT474 cells stably expressing FOXO3:ER that were transfected with scramble siRNA (siSCR) or siRNA against PUMA and left untreated or treated with 4-OHT. Data are mean percentages of annexin V–positive cells ± SD from three independent experiments. **P < 0.01.
Fig. 4
Fig. 4
BIM and PUMA are required for erlotinib-induced apoptosis of EGFR-addicted lung cancer cells. (A) HCC827 cells, untreated or treated with erlotinib, were immunoblotted with the indicated antibodies (n = 3 independent experiments). (B) Quantification of cell death by FACS analysis after annexin V staining of HCC827 cells transfected with scramble siRNA (siSCR) or siRNA against BIM and/or PUMA and left untreated or treated with erlotinib. Data are mean percentages of annexin V–positive cells ± SD from three independent experiments. *P < 0.05; **P < 0.01; ***P < 0.001. (C) PUMA mRNA abundance was assessed in HCC827 cells transfected with scramble siRNA (siSCR) or siRNA against FOXO1 and/or FOXO3 and left untreated or treated with erlotinib. Data are normalized against GAPDH and are means ± SD of three independent experiments. **P < 0.01; ***P < 0.001. (D) Quantification of cell death by FACS analysis after annexin V staining of HCC827 cells transfected with scramble siRNA (siSCR) or siRNA against FOXO1 and/or FOXO3 and left untreated or treated with erlotinib. Data are mean percentages of annexin V–positive cells ± SD from three independent experiments. *P < 0.05; **P < 0.01; ***P < 0.001. (E) HCC827 cells, untreated or treated with erlotinib, were subjected to ChIP with the anti-FOXO1 antibody, followed by PCR amplification of the PUMA promoter. A 5′ sequence located 4 kb upstream of the transcription start site of PUMA served as a negative control (n = 2 independent experiments).
Fig. 5
Fig. 5
BIM and PUMA mediate HER2 inactivation–induced apoptosis in vivo. (A) MTB+TAN+ female mice were administered doxycycline water to induce HER2. When mice developed tumors measuring 1 cm in the longest dimension, doxycycline was withdrawn for 24 hours to turn off HER2. Tumor lysates were immunoblotted with the indicated antibodies (n = 3 independent experiment). A mammary gland from a mouse that was never given doxycycline served as a control. (B) MTB+TAN+ (WT), MTB+TAN+Bim−/− (Bim KO), and MTB+TAN+Puma−/− (Puma KO) female mice were administered doxycycline to induce tumor formation. When mice developed tumors measuring 1 cm in the longest dimension, doxycycline was withdrawn for 3 days and tumor volume was measured using calipers. Data are mean percentages of tumor reduction ± SD. ***P < 0.01. WT, wild type; KO, knockout. (C) Immunohistochemistry for cleaved caspase-3 in tumors obtained from MTB+TAN+ (WT), MTB+TAN+Bim−/− (Bim KO), or MTB+TAN+Puma−/− (Puma KO) female mice 24 hours after doxycycline withdrawal (n = 2 independent experiments). Scale bars, 50 μm. (D) Normal mammary glands or 1-cm tumors obtained from female mice with the indicated genotypes in the presence of doxycycline (HER2 on) or 24 hours after doxycycline withdrawal (HER2 off) were assessed for caspase-3/7 activity using a luciferase-based assay. Data are means ± SD. *P < 0.05; **P < 0.01.
Fig. 6
Fig. 6
PUMA mediates EGFR inactivation–induced apoptosis in vivo. (A) TetO-EGFRL858R; CCSP-rtTA (WT) or TetO-EGFRL858R; CCSP-rtTA; Puma−/− (Puma KO) mice were fed doxycycline-impregnated food to induce lung tumors. Tumor growth was monitored by MRI. When mice developed tumors measuring 0.5 cm in the longest dimension detected by MRI, doxycycline was withdrawn for 72 hours to turn off EGFRL858R. Tumor reduction was assessed by MRI. Tumor volumes were calculated using ImageJ software. Data are mean percentages of tumor reduction ± SD. ***P < 0.05. (B) Representative magnetic resonance images of lung tumors from TetO-EGFRL858R; CCSP-rtTA (WT) or TetO-EGFRL858R; CCSP-rtTA; Puma−/− (Puma KO) mice before (EGFR on) and after doxycycline withdrawal for 3 days (EGFR off) (n = 4 independent experiments). Arrowheads indicate lung tumors. Scale bars, 5 mm. (C) Signal transduction pathways leading to the activation of BIM and PUMA upon inhibition of EGFR or HER2.
Fig. 7
Fig. 7
PI3K inhibitors and ABT-737 synergize to kill tyrosine kinase inhibitor–resistant cancer cells. (A) Quantification of cell death by FACS analysis after annexin V staining of H1650 cells untreated or treated with the indicated chemicals. Protein lysates were immunoblotted with the indicated antibodies (n = 2 independent experiments). (B) Quantification of cell death by FACS analysis after annexin V staining of H1975 cells untreated or treated with the indicated chemicals. Protein lysates were immunoblotted with the indicated antibodies (n = 2 independent experiments). (C) Quantification of cell death by FACS analysis after annexin V staining of HCC1954 cells untreated or treated with the indicated chemicals. Protein lysates were immunoblotted with the indicated antibodies (n = 2 independent experiments). (D) Quantification of cell death by FACS analysis after annexin V staining of H1650 or HCC1954 cells transfected with scramble siRNA (siSCR) or siRNA against PUMA and left untreated or treated with the indicated chemicals. Data are mean percentages of annexin V–positive cells ± SD from three independent experiments. **P < 0.01; ***P < 0.001.

Similar articles

Cited by

References

    1. Sellers WR. A blueprint for advancing genetics-based cancer therapy. Cell. 2011;147:26–31. - PubMed
    1. Weinstein IB. Cancer. Addiction to oncogenes—The Achilles heal of cancer. Science. 2002;297:63–64. - PubMed
    1. Youle RJ, Strasser A. The BCL-2 protein family: Opposing activities that mediate cell death. Nat. Rev. Mol. Cell Biol. 2008;9:47–59. - PubMed
    1. Wang X. The expanding role of mitochondria in apoptosis. Genes Dev. 2001;15:2922–2933. - PubMed
    1. Letai A, Bassik MC, Walensky LD, Sorcinelli MD, Weiler S, Korsmeyer SJ. Distinct BH3 domains either sensitize or activate mitochondrial apoptosis, serving as prototype cancer therapeutics. Cancer Cell. 2002;2:183–192. - PubMed

Publication types

MeSH terms