. 2013 Mar;3(3):558-68.
doi: 10.1002/ece3.447. Epub 2013 Jan 31.

Early gene expression divergence between allopatric populations of the house mouse (Mus musculus domesticus)

Affiliations

Early gene expression divergence between allopatric populations of the house mouse (Mus musculus domesticus)

Jarosław Bryk et al. Ecol Evol. 2013 Mar.

Abstract

Divergence of gene expression is known to contribute to the differentiation and separation of populations and species, although the dynamics of this process in early stages of population divergence remains unclear. We analyzed gene expression differences in three organs (brain, liver, and testis) between two natural populations of Mus musculus domesticus that have been separated for at most 3000 years. We used two different microarray platforms to corroborate the results at a large scale and identified hundreds of genes with significant expression differences between the populations. We find that although the three tissues have similar number of differentially expressed genes, brain and liver have more tissue-specific genes than testis. Most genes show changes in a single tissue only, even when expressed in all tissues, supporting the notion that tissue-specific enhancers act as separable targets of evolution. In terms of functional categories, in brain and to a smaller extent in liver, we find transcription factors and their targets to be particularly variable between populations, similar to previous findings in primates. Testis, however, has a different set of differently expressed genes, both with respect to functional categories and overall correlation with the other tissues, the latter indicating that gene expression divergence of potential importance might be present in other datasets where no differences in fraction of differentially expressed genes were reported. Our results show that a significant amount of gene expression divergence quickly accumulates between allopatric populations.

Keywords: Evolution; gene expression; population divergence; wild mice.


Figures

Figure 1
Figure 1
Wild male Mus musculus domesticus from the German population. Photograph by Christine Pfeifle.
Figure 2
Figure 2
Spearman's rank correlations of t statistics between pairs of tissues from both populations on both platforms for 2762 genes with equal variance between the populations in both platforms and expressed in all tissues in both platforms. Outliers beyond t statistic smaller than −10 and bigger than 10 were omitted from the graphs. Significance values (test for equality of regression slopes (Dalgaard ; Zar 2010)): brain–liver vs brain–testis pAffymetrix = 6.05 × 10⁻¹² and pAgilent = 3.34 × 10⁻⁷; brain–liver vs liver–testis pAffymetrix = 1.41 × 10⁻⁹ and pAgilent=1.14 × 10⁻⁹; brain–testis vs liver–testis pAffymetrix = 0.23 and pAgilent = 0.25.
Figure 3
Figure 3
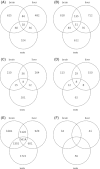
Number of genes differentially expressed between French and German population in different tissues and the overlap of genes between different tissues for A) Affymetrix B) Agilent C) combined set of genes. D) Same as for C, but for genes expressed in all three tissues. E) Number of genes expressed in different tissues expressed in both platforms. F) Number of genes expressed in a single tissue only in both platforms.
Figure 4
Figure 4
Hierarchical clustering of mean normalized expression levels for 113 genes expressed in all tissues and differentially expressed only in brain in each sample. Columns for liver and testis (both for n = 15 genes in both platforms) show mean normalized expression level of these genes in each sample in the respective tissue. Filled circles (samples 1–6): German population; empty cicrles (samples 7–12): French population. Error bars are standard error of the mean. Significance values (two–sided t-test without assuming equal variance, comparing mean normalized expression levels between the populations): pAffymetrixBrain = 7.37 × 10⁻⁵, pAffymetrixLiver = 0.16, pAffymetrixTestis=0.25; pAgilentBrain = 2.75 × 10⁻⁶, pAgilentLiver = 0.31, pAgilentTestis = 3.7 × 10⁻⁴. Please note that the pAgilent Testis was significant only in the presented case. Clustering calculations performed for liver and testis otherwise produced nonsignificant values.
Figure 5
Figure 5
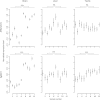
Mean scaled divergence and 95% confidence intervals in gene expression in different tissues in groups with different level of divergence. A) German versus French population of Mus musculus domesticus based on Affymetrix (filled circles) or Agilent (empty circles) data; divergence time less than 3000 years (Cucchi and Vigne ; Bonhomme et al. 2011) B) Average between pairwise comparisons of Mus m. musculus, Mus m. domesticus, and Mus m. castaneus, diverged 500,000–800,000 years ago (Guénet & Bonhomme 2003) C) between Mus spretus and average from all pairwise comparisons of Mus musculus subspecies; diverged 1–1.5 Mya (Boursot et al. 1993) D) humans versus chimpanzees, diverged 5–7 Mya (Patterson et al. 2006). Note that panel D is plotted on a different scale. Panels B and C are from (Voolstra et al. 2007) (data kindly provided by Bettina Harr and Christian Voolstra), panel D is based on data from (Khaitovich et al. 2005) provided by Mehmet Somel.
Figure 6
Figure 6
Nonspecific filtering of the Affymetrix data to remove unexpressed and/or uninformative probes from the data. A) Distribution of number of genes and expression levels in the unfiltered dataset in the brain (n = 15041 genes) B) The same distribution after removing 5956 genes for which interquartile range was less than shorth of the distribution.

Similar articles

Cited by

References

    1. Blekhman R, Oshlack A, Chabot AE, Smyth GK, Gilad Y. Gene regulation in primates evolves under tissue-specific selection pressures. PLoS Genet. 2008;4:e1000271. - PMC - PubMed
    1. Bonhomme F, Orth A, Cucchi T, Rajabi-Maham H, Catalan J, Boursot P, et al. Genetic differentiation of the house mouse around the Mediterranean basin: matrilineal footprints of early and late colonization. P. Roy. Soc. B-Biol. Sci. 2011;278:1034–1043. - PMC - PubMed
    1. Boursot P, Auffray J, Britton-Davidian J, Bonhomme F. The evolution of house mice. Ann. Rev. Ecol. Evol. Syst. 1993;24:119–152.
    1. Brawand D, Soumillon M, Necsulea A, Julien P, Csárdi G, Harrigan P, et al. The evolution of gene expression levels in mammalian organs. Nature. 2011;478:343–348. - PubMed
    1. Carroll SB. Evo-devo and an expanding evolutionary synthesis: a genetic theory of morphological evolution. Cell. 2008;134:25–36. - PubMed