

Comparison of different spectral domain OCT scanning protocols for diagnosing preperimetric glaucoma
- PMID: 23532529
- PMCID: PMC3653374
- DOI: 10.1167/iovs.13-11676
Comparison of different spectral domain OCT scanning protocols for diagnosing preperimetric glaucoma
Abstract
Purpose: To compare the ability of spectral-domain optical coherence tomography (SDOCT) retinal nerve fiber layer (RNFL), optic nerve head (ONH), and macular measurements to detect preperimetric glaucomatous damage.
Methods: The study included 142 eyes from 91 patients suspected of having the disease based on the appearance of the optic disc. All eyes had normal visual fields before the imaging session. Forty-eight eyes with progressive glaucomatous damage were included in the preperimetric glaucoma group. Ninety-four eyes without any evidence of progressive glaucomatous damage and followed untreated for 12.8 ± 3.6 years were used as controls. Areas under the receiver operating characteristic curves (AUC) were calculated to summarize diagnostic accuracies of the parameters.
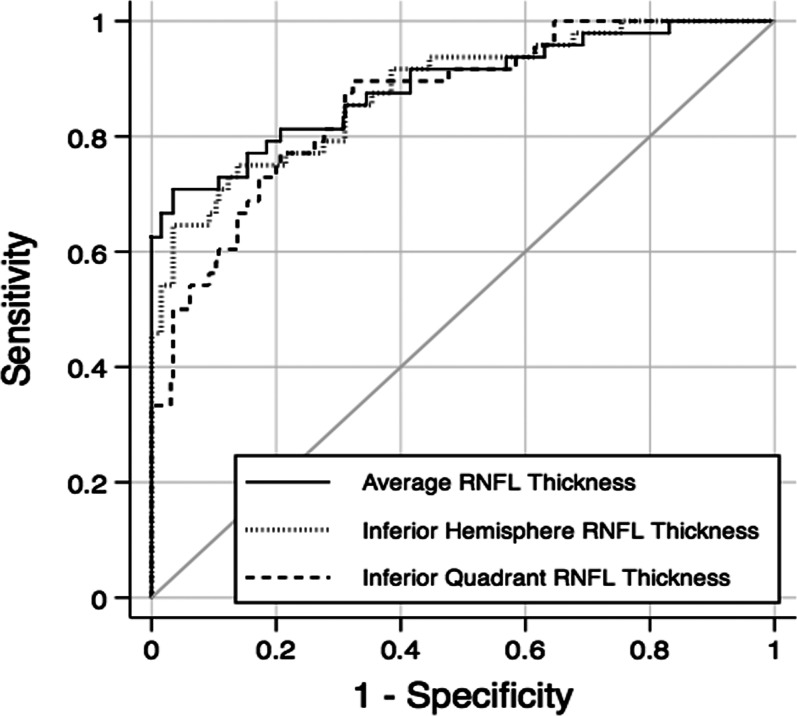
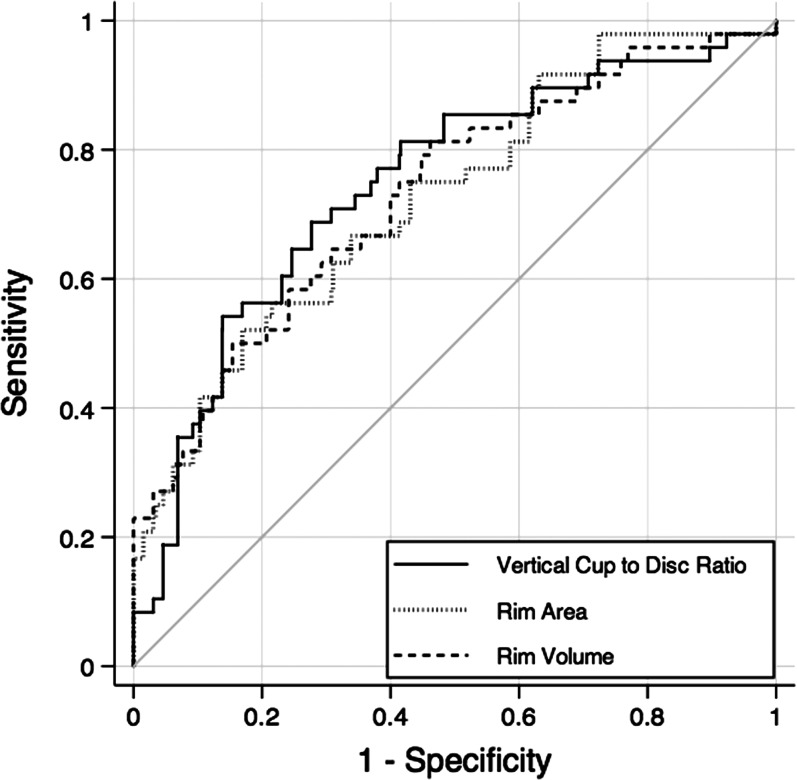
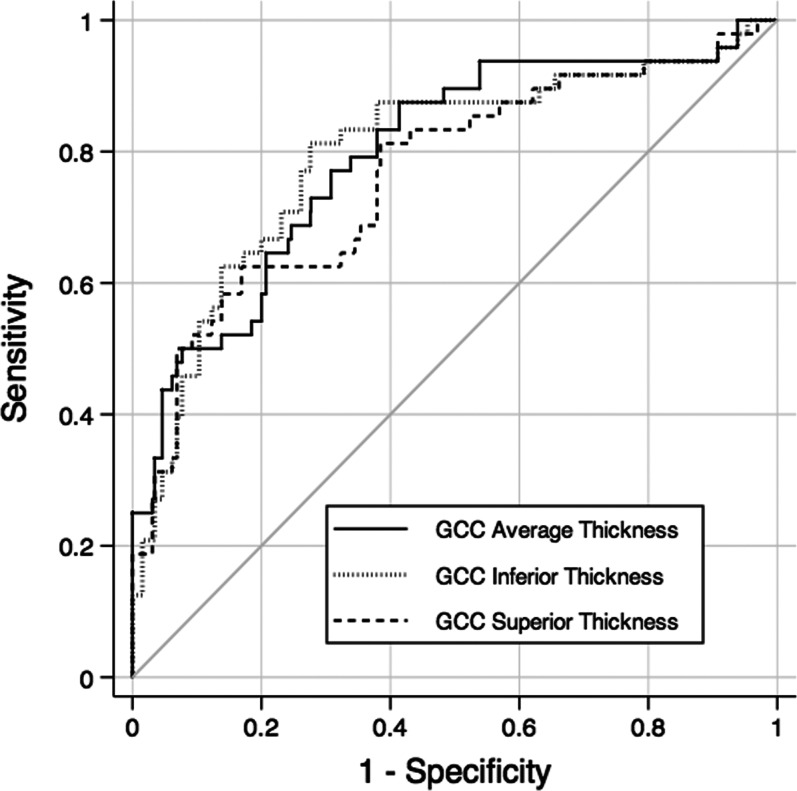
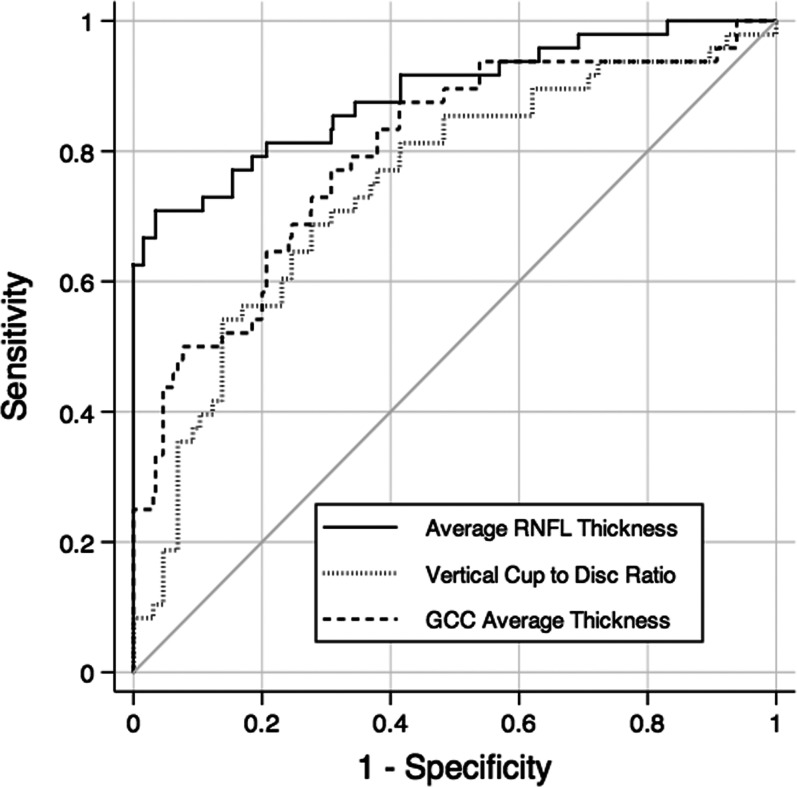
Results: The three RNFL parameters with the largest AUCs were average RNFL thickness (0.89 ± 0.03), inferior hemisphere average thickness (0.87 ± 0.03), and inferior quadrant average thickness (0.85 ± 0.03). The three ONH parameters with the largest AUCs were vertical cup-to-disc ratio (0.74 ± 0.04), rim area (0.72 ± 0.05), and rim volume (0.72 ± 0.05). The three macular parameters with the largest AUCs were GCC average thickness (0.79 ± 0.04), GCC inferior thickness (0.79 ± 0.05), and GCC superior thickness (0.76 ± 0.05). Average RNFL thickness performed better than vertical cup-to-disc ratio (0.89 vs. 0.74; P = 0.007) and GCC average thickness (0.89 vs. 0.79; P = 0.015).
Conclusions: SDOCT RNFL measurements performed better than ONH and macular measurements for detecting preperimetric glaucomatous damage in a cohort of glaucoma suspects. (ClinicalTrials.gov number, NCT00221897.).
Keywords: diagnosis; glaucoma; preperimetric.
Figures
References
-
- Johnson CA, Sample PA, Zangwill LM, et al. Structure and function evaluation (SAFE): II. Comparison of optic disk and visual field characteristics. Am J Ophthalmol. 2003; 135: 148–154 - PubMed
-
- Johnson CA, Cioffi GA, Liebmann JR, Sample PA, Zangwill LM, Weinreb RN. The relationship between structural and functional alterations in glaucoma: a review. Semin Ophthalmol. 2000; 15: 221–233 - PubMed
-
- Harwerth RS, Carter-Dawson L, Smith EL III, Barnes G, Holt WF, Crawford ML. Neural losses correlated with visual losses in clinical perimetry. Invest Ophthalmol Vis Sci. 2004; 45: 3152–3160 - PubMed
-
- Zeimer R, Asrani S, Zou S, Quigley H, Jampel H. Quantitative detection of glaucomatous damage at the posterior pole by retinal thickness mapping. A pilot study. Ophthalmology. 1998; 105: 224–231 - PubMed
Publication types
MeSH terms
Associated data
Grants and funding
LinkOut - more resources
Full Text Sources
Other Literature Sources
Medical
