. 2013 May 1;126(Pt 9):2102-13.
doi: 10.1242/jcs.124834. Epub 2013 Mar 26.

Specific removal of TACC3-ch-TOG-clathrin at metaphase deregulates kinetochore fiber tension

Affiliations

Specific removal of TACC3-ch-TOG-clathrin at metaphase deregulates kinetochore fiber tension

Liam P Cheeseman et al. J Cell Sci. .

Abstract

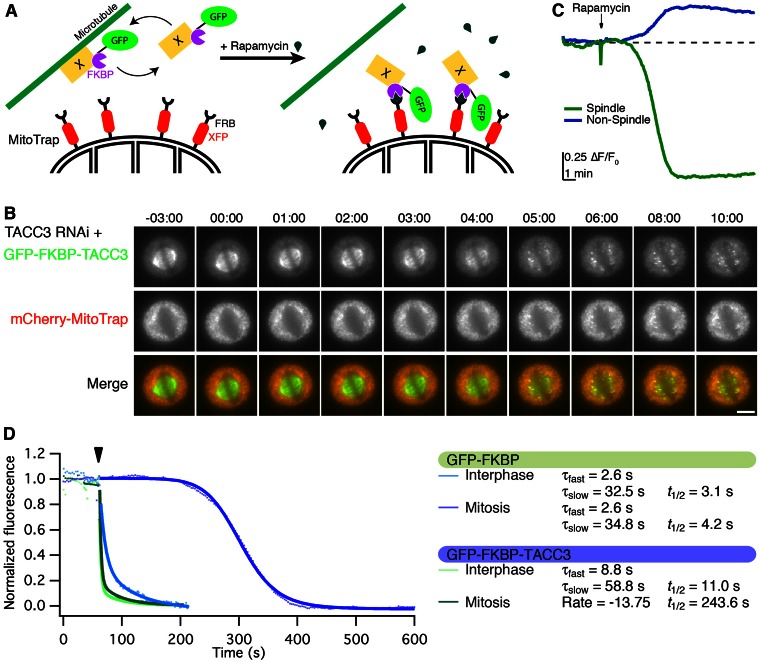
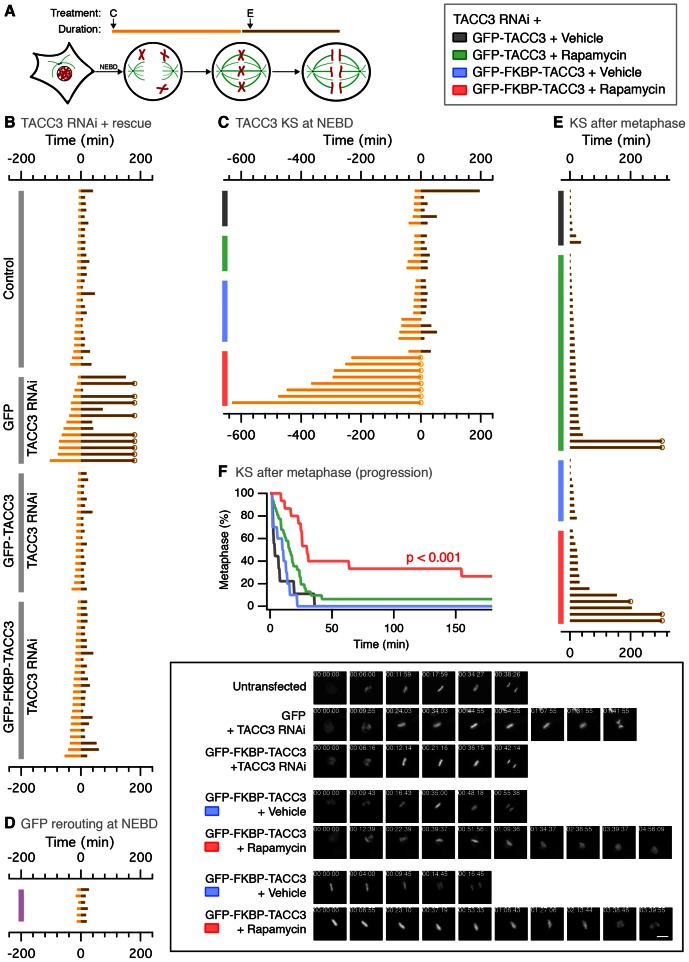
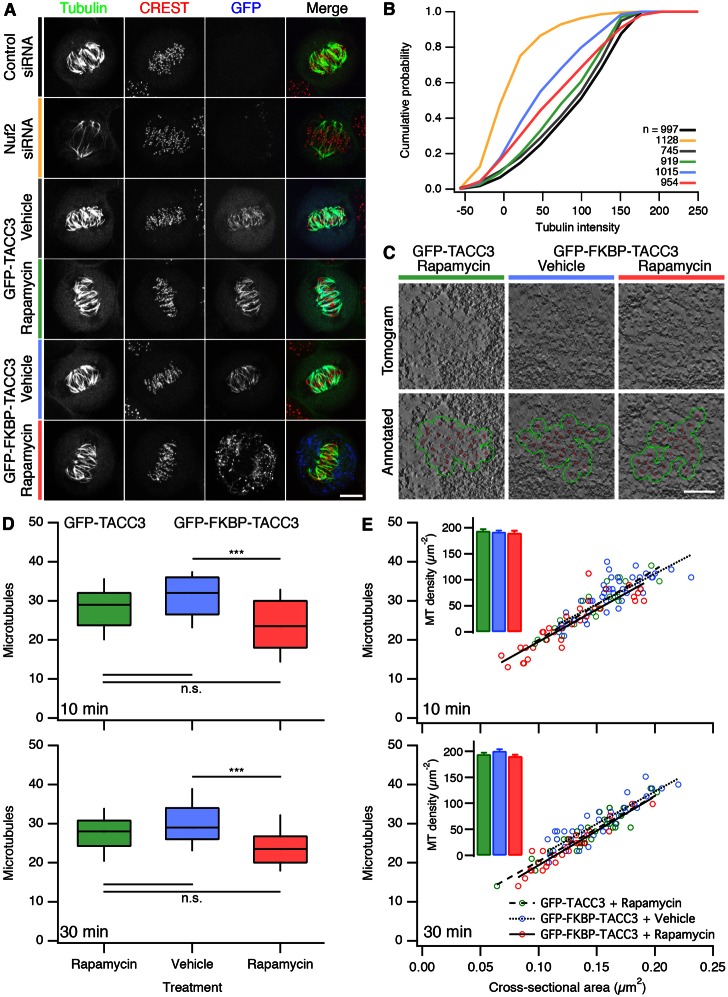
Microtubule-associated proteins of the mitotic spindle are thought to be important for the initial assembly and the maintenance of spindle structure and function. However, distinguishing assembly and maintenance roles for a given protein is difficult. Most experimental methods for protein inactivation are slow and therefore affect both assembly and maintenance. Here, we have used 'knocksideways' to rapidly (∼5 minutes) and specifically remove TACC3-ch-TOG-clathrin non-motor complexes from kinetochore fibers (K-fibers). This method allows the complex to be inactivated at defined stages of mitosis. Removal of TACC3-ch-TOG-clathrin after nuclear envelope breakdown caused severe delays in chromosome alignment. Inactivation at metaphase, following a normal prometaphase, significantly delayed progression to anaphase. In these cells, K-fiber tension was reduced and the spindle checkpoint was not satisfied. Surprisingly, there was no significant loss of K-fiber microtubules, even after prolonged removal. TACC3-ch-TOG-clathrin removal during metaphase also resulted in a decrease in spindle length and significant alteration in kinetochore dynamics. Our results indicate that TACC3-ch-TOG-clathrin complexes are important for the maintenance of spindle structure and function as well as for initial spindle assembly.

Keywords: Checkpoint; Knocksideways; Microtubule; Mitotic spindle; Rapid inactivation.


Figures

Fig. 1.
Fig. 1.
Rapid, induced removal of TACC3 by knocksideways. (A) Diagram of knocksideways of a microtubule-associated protein. Protein X is depleted by RNAi and a shRNA-refractory version is re-expressed. Left: In the absence of rapamycin, the recombinant GFP- and FKBP-tagged protein X cycles on and off the microtubule. Right: Upon addition of rapamycin, the FKBP domain heterodimerizes with the FRB of XFP-MitoTrap (red) located on the mitochondria. (B) Video stills of TACC3 KS in a metaphase HeLa cell. Rapamycin (200 nM) was added at time zero (time is shown in minutes:seconds). GFP-FKBP-TACC3 is completely removed in ∼5 minutes. Scale bar: 10 µm. (C) Quantification of GFP ΔF/F0 in the indicated areas over time during TACC3 KS. See supplementary material Movie 1. (D) Comparison of rerouting kinetics for GFP-FKBP-TACC3 or GFP-FKBP to mitochondria in interphase or mitosis, single cell examples. An overlay of curve fits to describe the rerouting are shown on the same time scale. Rapamycin application is denoted by the arrowhead. GFP-FKBP-TACC3 in mitosis was best fit by the Hill logistic function, all other data were best fit by a double exponential function.
Fig. 2.
Fig. 2.
Removal of TACC3 from mitotic spindles by knocksideways. (A) Representative micrographs of TACC3 KS. TACC3-depleted cells expressing PAGFP-MitoTrap (not visible) and the indicated TACC3 construct were treated for 30 minutes with 200 nM rapamycin or vehicle, fixed and stained for tubulin. Color coding for KS conditions is used throughout the paper. Full results are shown in supplementary material Fig. S1. Scale bar: 10 µm. (B) Bar chart to show quantification of TACC3 immunofluorescence in various experimental conditions. Total TACC3 was detected using anti-TACC3/A568 and analyzed by confocal microscopy. Aurora-A inhibition: using MLN8237 (1 µM) compared to vehicle. TACC3 expression: control RNAi + GFP, TACC3 RNAi + GFP and GFP-TACC3 expression (with no RNAi). TACC3 KS: TACC3 RNAi + PAGFP-MitoTrap + GFP-TACC3 or GFP-FKBP-TACC3; treated with vehicle or rapamycin (200 nM). Mean ± s.e.m. for spindle regions and cytoplasm. Number of cells was 18–31 as indicated, from two experiments. **P<0.001 compared with vehicle (far left) values, one-way ANOVA with Tukey–Kramer post-hoc test.
Fig. 3.
Fig. 3.
TACC3 KS removes ch-TOG, clathrin and GTSE1 from the spindle without affecting other spindle proteins. Representative confocal micrographs of TACC3-depleted HeLa cells in metaphase expressing GFP-FKBP-TACC3 (green) and PAGFP-MitoTrap (not visible) that were treated with vehicle or rapamycin (200 nM) for 10 minutes, fixed and stained for the indicated proteins (red). TACC3 KS removed ch-TOG, clathrin heavy chain (CHC) and GTSE1 from the spindle. NuMA, HURP and Eg5 were unaffected by TACC3 KS. Zoomed areas show the colocalization of proteins at mitochondria following TACC3 KS. The results are typical of this experiment, repeated four times. See supplementary material Fig. S1 for full results. Scale bar: 10 µm.
Fig. 4.
Fig. 4.
Loss of inter-microtubule bridges from K-fibers following TACC3 KS. (A) TACC3-depleted HeLa cells at metaphase expressing GFP-FKBP-TACC3 and mCherry-MitoTrap were treated with rapamycin (200 nM) or vehicle for 10 minutes, fixed and processed for CLEM. The cell was located, 80-nm longitudinal sections taken (EM) and the bridge frequency in K-fibers quantified. Scale bars: 10 µm (left) and 500 nm (right). (B) Example micrographs to show visualization of inter-MT bridges for quantification. Annotated micrograph (right) shows MTs (green) and bridges (red). Scale bar: 50 nm. (C) Tukey box plot of inter-MT bridge frequency in K-fibers, expressed per micron of total MT length. In TACC3 KS cells, a significant loss of MT crosslinkers was observed: control n = 4 cells (20 sections), TACC3 KS n = 5 cells (25 sections); Student’s t-test, P = 0.037.
Fig. 5.
Fig. 5.
TACC3 KS at NEBD or after metaphase reveals two different aspects of crosslinking function. (A) Diagram to show the timing of mitosis and experimental conditions. (B) Mitotic progression of control cells (no RNAi) and TACC3-depleted cells expressing GFP, GFP-TACC3 or GFP-FKBP-TACC3. TACC3 RNAi caused delay in chromosomal alignment in HeLa cells (NEBD-to-metaphase timing, gold) and also a delay in anaphase onset (metaphase-to-anaphase timing, brown). Cells that did not reach anaphase within the movie are marked with a circle. (C) Mitotic progression of TACC3-depleted HeLa cells expressing GFP-TACC3 or GFP-FKBP-TACC3; either vehicle or rapamycin (200 nM) was added at NEBD. (D) Normal mitotic progression of cells where GFP-FKBP was rerouted to mitochondria at NEBD. (E) Similar graph as in C except that TACC3 KS was performed after metaphase. All cells in the figure coexpressed H2B-mCherry for chromosome visualization and PAGFP-MitoTrap. (F) ‘Survival curves’ of the data shown in E. Example video stills from the indicated conditions are shown in the boxed area. Timings are indicated in hh∶mm∶ss. Scale bar: 20 µm.
Fig. 6.
Fig. 6.
TACC3 KS at metaphase reduces K-fiber tension and cells are arrested by the spindle checkpoint. (A) Representative confocal micrographs to show the recruitment of Mad2 to kinetochores following TACC3 KS. TACC3-depleted HeLa cells expressing GFP-TACC3 or GFP-FKBP-TACC3 were treated as indicated in the key in B. Inset shows three Mad2-positive kinetochores (2.5× zoom). Scale bar: 10 µm. (B) Proportion of cells with a satisfied or active spindle checkpoint, as revealed by Mad2 presence at kinetochores. Bars show mean ± s.e.m. of three experiments (n = 90–93 cells). (C) Histograms of inter-kinetochore distances. Histograms (colored according to the key in B) are shown for GFP-TACC3 or GFP-FKBP-TACC3 treated with vehicle or rapamycin (200 nM) for 30 minutes, overlaid on a histogram of unattached inter-kinetochore distances from prophase/early prometaphase cells (light grey). The mean inter-kinetochore distance is shown by a dashed line. The unattached data were fitted with a log-normal function and all other data were fitted with a single Gaussian function. TACC3 KS cells (red, n = 645 from 20 cells) displayed significantly reduced inter-kinetochore distance compared with controls (grey, n = 654 from 22 cells; green, n = 656 from 23 cells; blue, n = 578 from 23 cells), but was not significantly different from unattached kinetochores (n = 238 from 8 cells); ***P<0.001.
Fig. 7.
Fig. 7.
TACC3 KS at metaphase does not significantly alter kinetochore–microtubule attachments. (A,B) Cold-stable kinetochore–microtubule attachments. (A) Representative pictures of each condition analyzed are shown as maximum intensity projections of confocal Z-series micrographs. Metaphase cells were cold-treated, fixed and stained with anti-tubulin (green) and CREST (red); GFP channel (blue) shows TACC3 KS. Scale bar: 10 µm. (B) Analysis of confocal z-series micrographs to detect cold-stable kinetochore–microtubule attachments. Cumulative frequency plot to show the average tubulin signal adjacent to kinetochores. Ncell = 9–12 from two experiments. Nkinetochore is shown in the legend. (C) Representative views of electron tomograms of orthogonal sections of K-fibers in metaphase HeLa cells expressing mCherry-MitoTrap and GFP-TACC3 or GFP-FKBP-TACC3 treated as indicated. Overlaid are microtubules (red) and the calculated K-fiber perimeter (green). Scale bar: 100 nm. (D) Tukey box plots of K-fiber MT number in TACC3-depleted HeLa cells expressing mCherry-MitoTrap and GFP-TACC3 or GFP-FKBP-TACC3, treated with vehicle or rapamycin (200 nM) for 10 minutes (top) or 30 minutes (bottom). TACC3 KS (red) causes a slight reduction in MTs of K-fibers after both 10 minutes and 30 minutes of rapamycin application. The reduction was significantly lower than for vehicle-treated cells (ANOVA with Tukey–Kramer post-hoc test, ***P<0.01), but not when compared with rapamycin-treated GFP-TACC3-expressing cells (n.s. indicates P>0.05). (E) Plots of MT number versus K-fiber cross-sectional area after 10 minutes and 30 minutes of treatment. Lines of best fit show the similar MT density in all conditions. Insets show mean ± s.e.m. K-fiber MT density in control (green, blue) or TACC3 KS cells (red) (10-minute data: green, n = 22 K-fibers; blue, n = 54; red, n = 32. 30-minutes data: green, n = 32; blue, n = 38; red, n = 28). See supplementary material Fig. S4 for spatial analysis of K-fibers.
Fig. 8.
Fig. 8.
TACC3 KS at metaphase alters kinetochore dynamics and decreases spindle length. Analysis of kinetochore motions in live HeLa cells stably expressing CENP-A-GFP and Centrin-GFP. Cells were depleted of endogenous TACC3 and were coexpressing PAGFP-MitoTrap and either mCherry-TACC3 or mCherry-FKBP-TACC3 and were treated with DMSO (vehicle) or rapamycin (200 nM). (A–C) Three example kinetochore trajectories from typical cells are shown. Left: Images of automated kinetochore tracking. Right: Plots of kinetochore distances relative to the metaphase plate as a function of time. Tracks of two sisters are shown for each pair; difference plot is shown (dotted line). (D) Diagram to show the measurement of d and x. (E) Population data for sister separation (d, inter-kinetochore distance) and sister center normal position (x). (F) Sister center normal displacement (Δx auto-correlation). Line thickness represents 95% confidence interval. Peaks of negative and positive lobes (half- and full-period) are shown by dashed and full vertical lines, respectively. (G) Mean squared displacement analysis for kinetochore pairs. Error bars show s.e.m. (H) Image to show the automated 4D tracking of spindle poles (centrin-GFP) in addition to kinetochores (see Materials and Methods). See supplementary material Movie 3. (I) Euclidian interpolar distances (S) for each condition. Color coding is the same as in previous figures. (J) Scatter plots to show that the average inter-kinetochore distance (d) does not vary as a function of spindle length (S). Insets show control data (above) and TACC3 KS data (below) for reference; a line of best fit is shown (r2 = 0.08 and 0.11, respectively). Analysis in all figure panels is from four independent experiments.

References

    1. Barr A. R., Gergely F. (2008). MCAK-independent functions of ch-Tog/XMAP215 in microtubule plus-end dynamics. Mol. Cell. Biol. 28, 7199–7211 10.1128/MCB.01040-08 - DOI - PMC - PubMed
    1. Booth D. G., Hood F. E., Prior I. A., Royle S. J. (2011). A TACC3/ch-TOG/clathrin complex stabilises kinetochore fibres by inter-microtubule bridging. EMBO J. 30, 906–919 10.1038/emboj.2011.15 - DOI - PMC - PubMed
    1. Borner G. H., Antrobus R., Hirst J., Bhumbra G. S., Kozik P., Jackson L. P., Sahlender D. A., Robinson M. S. (2012). Multivariate proteomic profiling identifies novel accessory proteins of coated vesicles. J. Cell Biol. 197, 141–160 10.1083/jcb.201111049 - DOI - PMC - PubMed
    1. Brodsky F. M. (2012). Diversity of clathrin function: new tricks for an old protein. Annu. Rev. Cell Dev. Biol. 28, 309–336 10.1146/annurev-cellbio-101011-155716 - DOI - PubMed
    1. Cassimeris L., Becker B., Carney B. (2009). TOGp regulates microtubule assembly and density during mitosis and contributes to chromosome directional instability. Cell Motil. Cytoskeleton 66, 535–545 10.1002/cm.20359 - DOI - PubMed

Publication types

MeSH terms