. 2013 May 24;288(21):15194-210.
doi: 10.1074/jbc.M113.457408. Epub 2013 Mar 26.

Lewy body-like α-synuclein aggregates resist degradation and impair macroautophagy

Affiliations

Lewy body-like α-synuclein aggregates resist degradation and impair macroautophagy

Selcuk A Tanik et al. J Biol Chem. .

Abstract

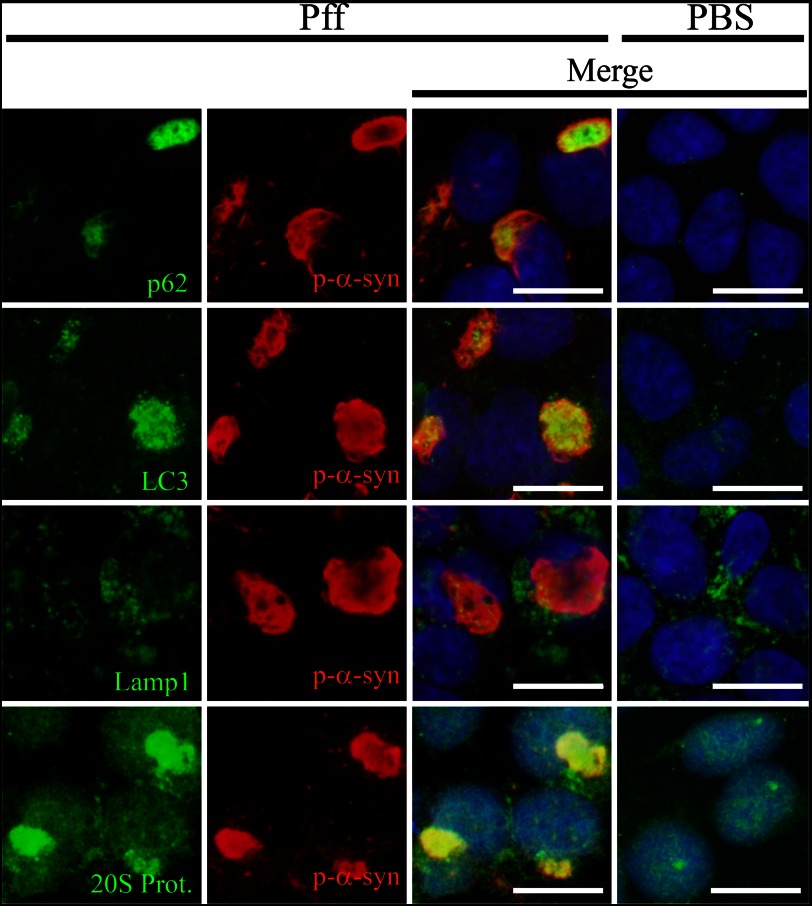
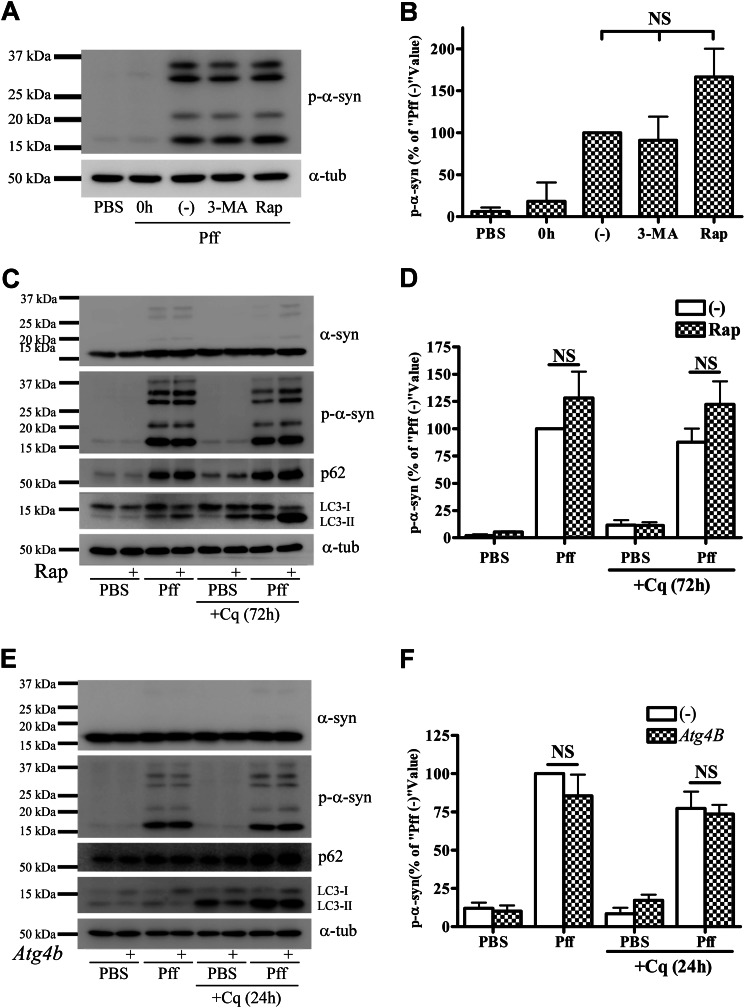
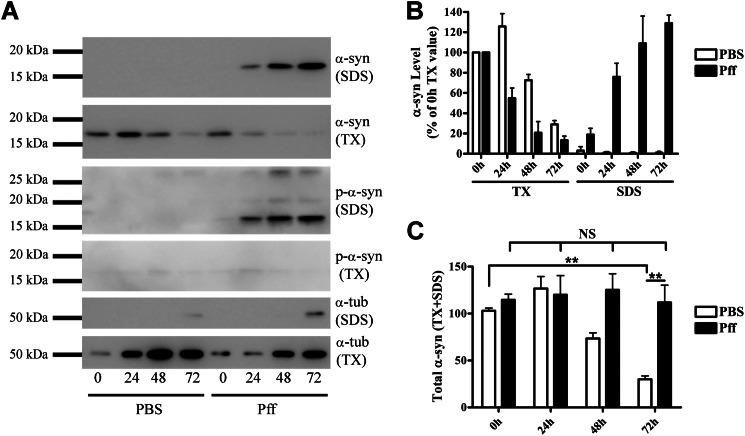
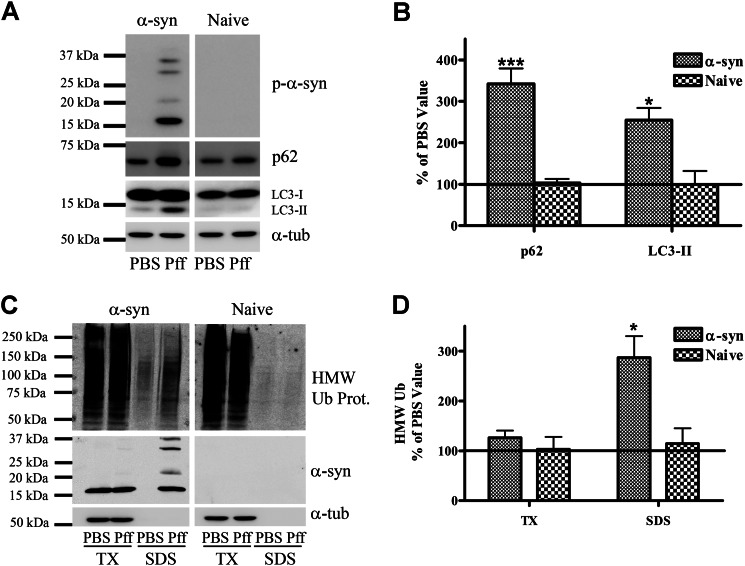
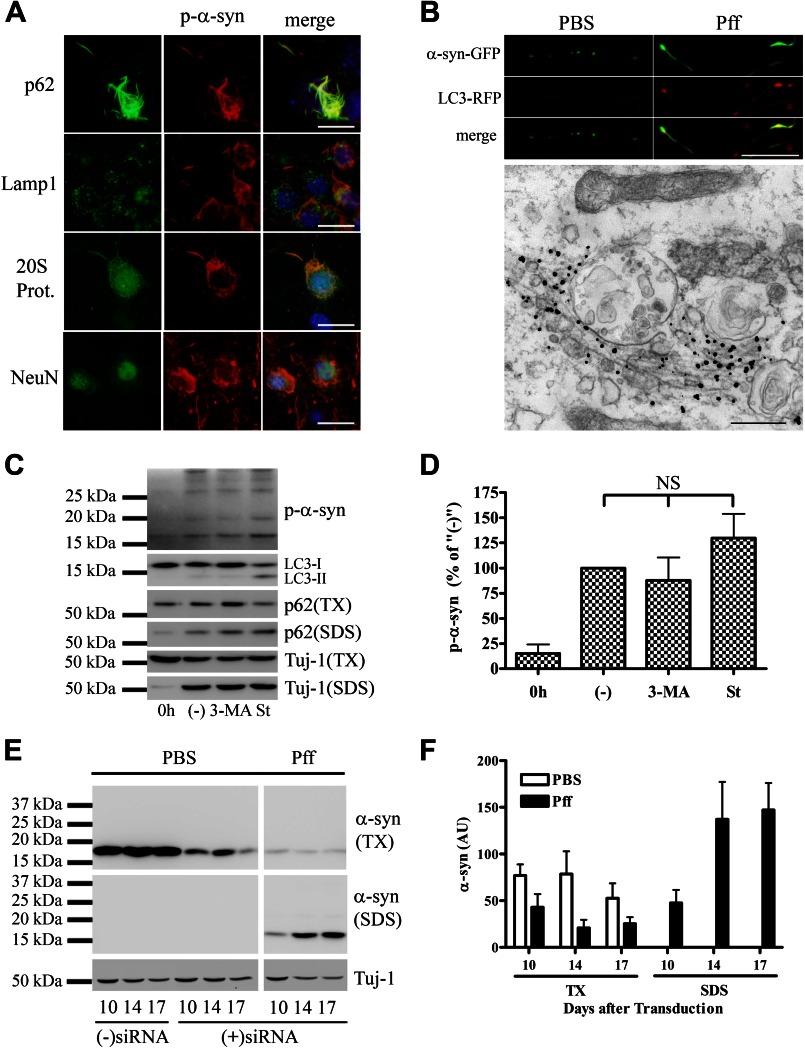
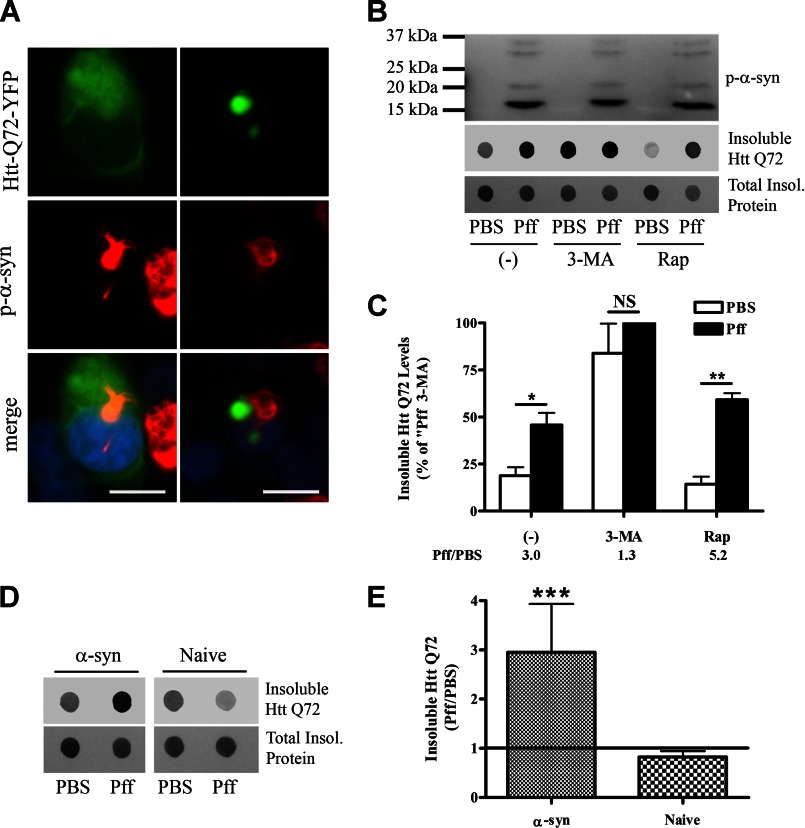
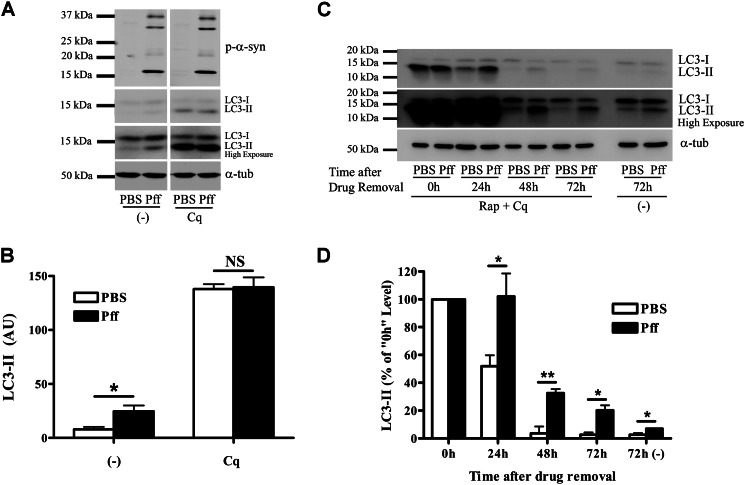
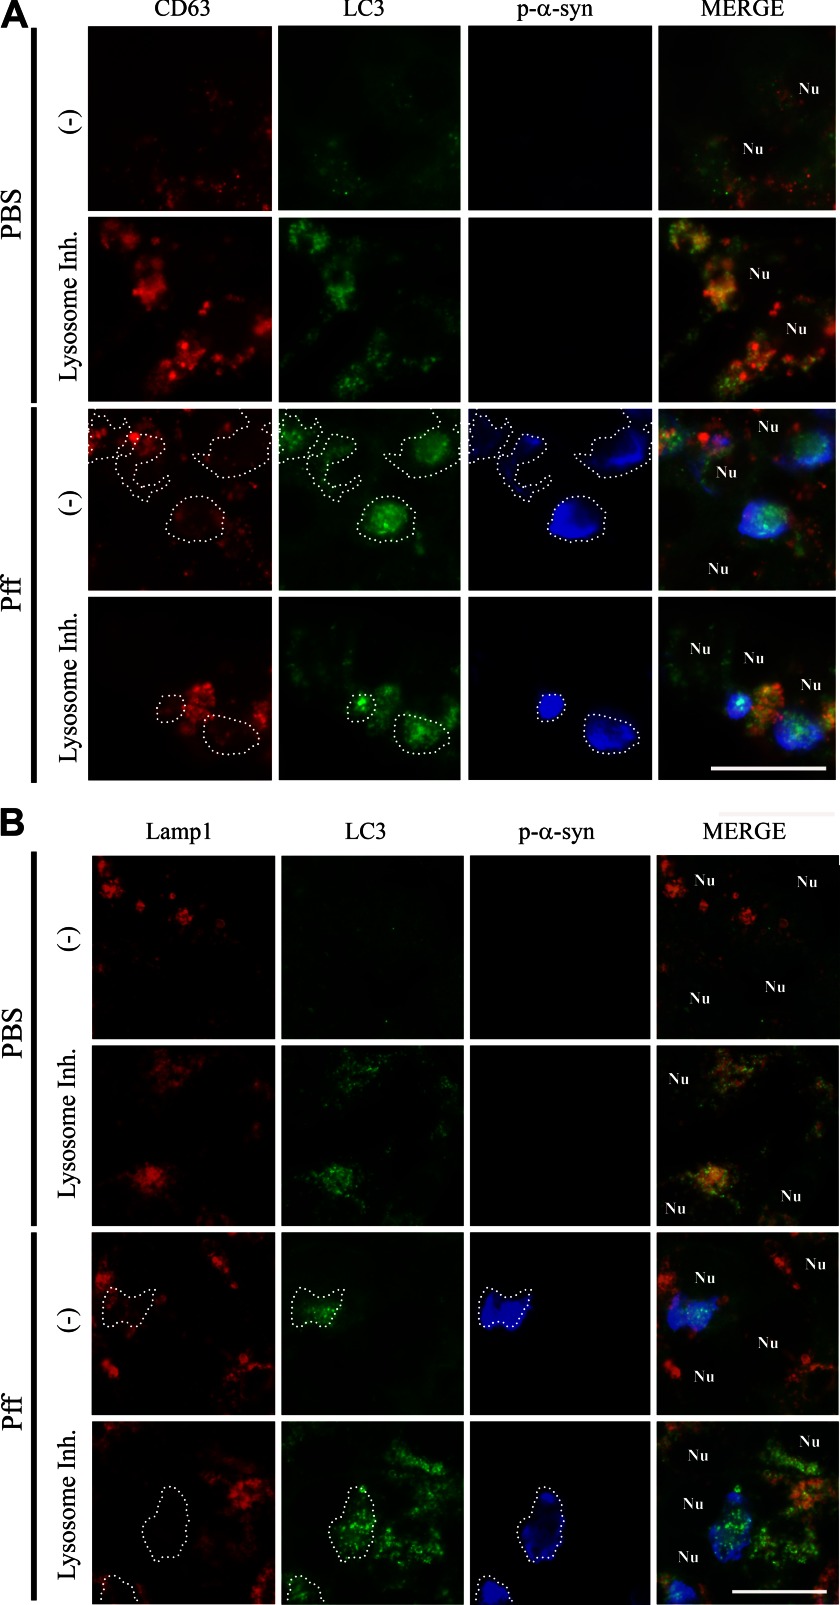
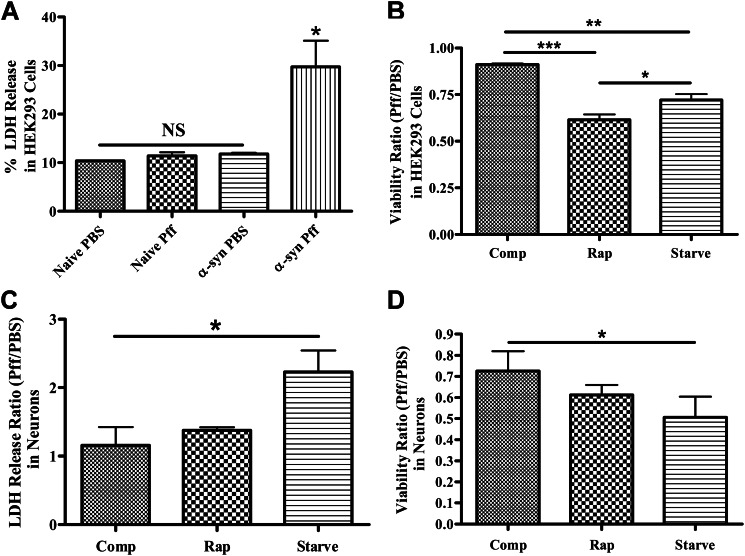
Cytoplasmic α-synuclein (α-syn) aggregates, referred to as Lewy bodies, are pathological hallmarks of a number of neurodegenerative diseases, most notably Parkinson disease. Activation of macroautophagy is suggested to facilitate degradation of certain proteinaceous inclusions, but it is unclear if this pathway is capable of degrading α-syn aggregates. Here, we examined this issue by utilizing cellular models in which intracellular Lewy body-like α-syn inclusions accumulate after internalization of pre-formed α-syn fibrils into α-syn-expressing HEK293 cells or cultured primary neurons. We demonstrate that α-syn inclusions cannot be effectively degraded, even though they co-localize with essential components of both the autophagic and proteasomal protein degradation pathways. The α-syn aggregates persist even after soluble α-syn levels have been substantially reduced, suggesting that once formed, the α-syn inclusions are refractory to clearance. Importantly, we also find that α-syn aggregates impair overall macroautophagy by reducing autophagosome clearance, which may contribute to the increased cell death that is observed in aggregate-bearing cells.

Keywords: Aggregation; Autophagy; Parkinson Disease; Protein Degradation; α-Synuclein.


Figures

FIGURE 1.
FIGURE 1.
Co-localization of protein degradation pathway components with α-syn aggregates. IF images of HEK293 α-syn cells 24 h after Pff transduction, stained with p-α-syn antibody (red), DAPI (blue), or antibodies to p62, LC3, Lamp1, and 20 S proteasome (green). Dispersed and punctate cytoplasmic staining of p62 and LC3 was observed in PBS-td cells. In Pff-td cells, p-α-syn aggregates showed strong co-localization with p62 and LC3. Similarly, there was diffuse staining of the 20 S proteasome in the PBS-td cells, whereas Pff-td cells had cytoplasmic 20 S proteasome staining that largely co-localized with α-syn aggregates. In contrast, Lamp1-positive vesicles were observed in both PBS-td and Pff-td cells, and these did not typically co-localize with p-α-syn aggregates. Scale bars, 20 μm.
FIGURE 2.
FIGURE 2.
Autophagy does not degrade α-syn aggregates. A and B, after 4 h of Pff transduction, HEK293 α-syn cells were treated with the autophagy inhibitor 3-MA (10 mm) or the autophagy activator Rap (0.2 μm) in starvation media for 24 h. Cells were subsequently extracted with SDS for IB. A, representative IB of p-α-syn and α-tubulin (α-tub), and B, quantification of IBs (n = 3). “0h” refers to cells that were harvested prior to drug treatment, and “(−)” refers to vehicle-treated cells. Minimal α-syn pathology was present when drug treatment was initiated, as shown in the 0h lane. Neither 3-MA nor rapamycin caused a significant change in p-α-syn levels. C and D, extended rapamycin treatment in a nutrient-rich condition does not induce clearance of aggregates. 4 h after Pff transduction, HEK293 α-syn cells were maintained in nutrient-rich media for 20 h, followed by rapamycin treatment for 72 h in the absence or presence of 15 μm Cq in nutrient-rich conditions. C, IB of p-α-syn, p62, LC3, and the loading control, α-tubulin. D, quantification of p-α-syn levels in IBs from three independent experiments, with data normalized to the mean p-α-syn level from vehicle-treated Pff-td cells. Significant activation of autophagy by rapamycin was evident because LC3-II accumulated in Cq and rapamycin co-treated cells, but this activation did not reduce aggregated α-syn levels. E and F, genetic inhibition of autophagy does not cause accumulation of p-α-syn aggregates. HEK293 α-syn-stable cells were transfected with the dominant negative autophagy inhibitor, mutant ATG4BC74A-strawberry, or with empty vector (−). Cells were transduced with Pff for 24 h, treated with 30 μm Cq for an additional 24 h, and then harvested 72 h after transfection. E, IB of p-α-syn, p62, LC3, and the loading control, α-tubulin. F, quantification of p-α-syn levels from three independent experiments, with data normalized to the mean p-α-syn level from empty vector-transfected Pff-td cells. ATG4B mutant (ATG4BC74A) prevents lipidation of LC3 to LC3-II, thereby inhibiting autophagosome closure and autophagy (38) resulting in a significant decrease in total and LC3-I-normalized LC3-II levels in ATG4B-transfected cells (2.34 ± 0.30 versus 0.63 ± 0.05 in Pff-td mock and ATG4B-transfected cells, respectively, p < 0.01) without changing aggregated p-α-syn levels. Error bars, ± S.E. One-way ANOVA with Tukey's post-hoc analysis (B) or Student's paired t test (D and F) was used to test for statistically significant differences. NS indicates p > 0.05.
FIGURE 3.
FIGURE 3.
Clearance of aggregated α-syn is severely impaired. HeLa T-Rex cells that express α-syn under the control of a dox-inducible promoter were induced with dox for 16 h. After removal of dox, cells were transduced for 4 h and then incubated in dox-free starvation media for 0, 24, 48, or 72 h until they were extracted in Triton X-100, followed by SDS. A, representative IB for endogenous α-syn, p-α-syn, and α-tubulin (α-tub). Equal volumes of cell extract were loaded. B, quantification of IBs (n = 4). The α-syn levels in Triton X-100 fractions at 0 h after transduction were used to normalize α-syn levels at other time points. C, graph showing total (Triton X-100 + SDS) α-syn levels (n = 4). In PBS-td cells, α-syn was rapidly cleared from cells, whereas in Pff-td cells, no net α-syn reduction was observed. Statistical significance was determined with Student's t test. NS and ** indicate p > 0.05 and p < 0.01, respectively.
FIGURE 4.
FIGURE 4.
Typical autophagy substrates accumulate in α-syn aggregate-bearing cells. A and B, 48 h after Pff transduction, α-syn and naive HEK293 cells were harvested, and proteins were extracted in SDS. A, representative IB for p-α-syn, p62, LC3, and the loading control, α-tubulin (α-tub). B, quantification of IBs (n ≥3), with protein levels in Pff-td cells expressed as a percentage of the corresponding PBS control level. C and D, 48 h after transduction, α-syn and naive HEK293 cells were extracted in Triton X-100 (TX) and then SDS. C, representative IB for HMW ubiquitin (Ub), α-syn, with α-tubulin as a loading control. D, quantification of IBs (n ≥3), with Pff-td cell levels expressed as a percentage of the corresponding PBS-td cell levels. Insoluble Ub protein levels did not increase in Pff-td naive HEK293 cells. Error bars, ±S.E. Student's paired t test was used to test for statistically significant differences. * indicates p < 0.05 and *** indicates p < 0.001, respectively.
FIGURE 5.
FIGURE 5.
α-Syn aggregates interact with protein degradation pathway components but cannot be effectively degraded in neurons. At 5 DIV, primary hippocampal neurons were transduced with human WT α-syn Pffs as described (27). At 19 DIV, cells were either fixed for IF or harvested for IB analysis. A, IF using p62, Lamp1, 20 S proteasome, neuronal nuclei (NeuN), and p-α-syn antibodies, demonstrating that neuronal α-syn aggregates co-localized with p62 and 20 S proteasome but not with Lamp1. B, top, fluorescence images of neurons transfected with LC3-mRuby and α-syn-GFP, showing accumulation of LC3 puncta that co-localized with p-α-syn aggregates in Pff-td neuronal processes. Bottom, immuno-EM, showing nano-gold-labeled p-α-syn aggregates at ×50,000 magnification, with proximal autophagic vesicle-like structures. Fibrillar nano-gold-labeled aggregates were typically not localized inside these structures despite close association. C and D, at DIV10, neurons were transduced with WT α-syn Pffs, and at DIV13 they were starved to activate autophagy or treated with 10 mm 3-MA to inhibit autophagy. Pff-td cells in one well were harvested at DIV13 to monitor pretreatment levels of p-α-syn (denoted as “0h”). The remaining cells were harvested at DIV15. C, representative IB for p-α-syn, LC3, p62, and neuron-specific βIII-tubulin (Tuj-1). TX, Triton X-100. D, quantification of IBs (n = 3), where “(−)” designates vehicle-treated cells. Minimal α-syn pathology was present when drug treatment was initiated, as shown in the 0h lane. 3-MA treatment increased soluble p62 levels, whereas starvation reduced it. However, neither treatment caused a significant change in p-α-syn levels. E and F, at DIV5, neurons were transduced with PBS or WT α-syn Pffs, and after 24 h, they were transfected with anti-α-syn siRNA or vehicle. Cells were harvested 10, 14, and 17 days after transduction. (−) siRNA denotes vehicle-transfected PBS-td cells harvested 10 days after transduction. E, representative IB for m-α-syn and Tuj-1. F, quantification of IBs from three independent experiments. Reduction of α-syn expression neither stopped aggregate growth nor caused clearance of aggregates. Error bars, ±S.E. One-way ANOVA with Tukey's post-hoc analysis was used to test for statistically significant differences. NS indicates p > 0.05. Scale bars, 20 μm (A), 20 μm and 500 nm (B).
FIGURE 6.
FIGURE 6.
Canonical autophagy substrates accumulate in neurons with α-syn accumulations. Primary hippocampal neurons from WT or α-syn knock-out (KO) mouse embryos were cultured in nutrient-rich neuronal media. At DIV5, neurons were transduced with human α-syn Pffs or PBS, and neurons were harvested for IB at DIV19. A and C, representative IB for p-α-syn, m-α-syn, Ub, p62, LC3 and α-tubulin (α-tub). B and D, effect of Pff transduction on levels of immunoblotted proteins in WT and α-syn KO neurons (n ≥3 for B and n = 5 for D). Protein levels are shown as a percentage of the values of PBS-td cells. Triton X-100 (TX)-insoluble HMW Ub proteins, p62, LC3-II, and m-α-syn levels were significantly increased in Pff-treated neurons, suggesting that the removal of these proteins was impaired. No change was observed in Pff-td α-syn KO neurons. Error bars, ±S.E. Student's paired t test was used to test for statistically significant differences. No asterisk, *, and ** indicate p > 0.05, p < 0.05, and p < 0.01, respectively.
FIGURE 7.
FIGURE 7.
Autophagy function is reduced in α-syn aggregate-bearing cells. A–C, 48 h after PBS or Pff transduction, HEK293 α-syn cells were transfected with YFP-tagged Htt Gln-72. 20 h after transfection, the cells were treated with 10 mm 3-MA, 0.2 μm Rap, or vehicle (−) for 24 h. A, diffuse, soluble (left) or aggregated (right) Htt Gln-72 (green) did not co-localize with p-α-syn (red) aggregates. B, representative IBs for p-α-syn and GFP (recognizes YFP tag of Htt) as well as Ponceau S total protein staining. The Htt Gln-72 within Triton X-100-insoluble cellular fractions was visualized by dot IBs. C, quantification of dot blots (n = 4). Ratio of insoluble Htt Gln-72 levels in Pff-td and PBS-td cells for each treatment condition is indicated below the graph. Pff transduction caused increased insoluble Htt Gln-72 protein levels. 3-MA treatment abolished the difference between Htt Gln-72 levels of PBS-td and Pff-td cells, suggesting that this difference in untreated cells resulted from impaired autophagy. D and E, 48 h after transduction, HEK293 α-syn or naive HEK293 cells were transfected with YFP-tagged Htt Gln-72 and 48 h after transfection were harvested for IB. D, representative IBs for GFP (insoluble Htt Gln-72) and Ponceau S (total protein staining). The Htt Gln-72 within Triton X-100-insoluble cellular fractions was visualized by dot IBs. E, quantification of dot blots (n = 4), shown as ratio of insoluble Htt Gln-72 levels of Pff-td and PBS-td cells. The significant increase in insoluble Htt Gln-72 levels observed in Pff-td α-syn HEK293 cells was absent in naive HEK293 cells. Error bars, ±S.E. Statistical significance was determined by Student's paired t test (B and E) and one-way ANOVA (D) with Tukey's post hoc analysis. NS, *, **, and *** indicate p > 0.05, p < 0.05, p < 0.01, and p < 0.001, respectively. Scale bars, 20 μm.
FIGURE 8.
FIGURE 8.
Autophagosome clearance is impaired in α-syn aggregate-bearing cells. A and B, HEK293 α-syn cells were incubated in nutrient-rich media for 4 h after Pff transduction, and the cells were treated with 100 μm of the lysosome inhibitor Cq 48 h after transduction. After 4 h of incubation with Cq, the cells were lysed in SDS buffer. A, representative IB for p-α-syn, LC3, and the loading control, α-tubulin (α-tub). B, quantification of IBs (n = 4). Pff-td and PBS-td cells showed comparable LC3-II levels upon complete inhibition of autophagosome clearance by Cq, suggesting that autophagosome clearance is impaired. C and D, HEK293 α-syn cells were incubated in nutrient-rich media 4 h after Pff transduction, and cells were treated with 0.2 μm rapamycin and 100 μm Cq 48 h after transduction. This “pulse” generated a large pool of autophagosomes in both Pff-td and PBS-td cells. After 4 h, the drugs were removed, and cells were harvested 0, 24, 48, and 72 h later. As a control, a set of cells was treated only with vehicle and were harvested 72 h after treatment. C, representative IB for LC3 and α-tubulin. D, quantification of IBs (n ≥3). Control cells rapidly cleared accumulated autophagosomes, whereas this clearance was significantly inhibited in Pff-td cells. Error bars, ±S.E. B and D, Student's t test was used to test for statistically significant differences. NS, *, and ** indicate p > 0.05, p < 0.05, and p < 0.01, respectively.
FIGURE 9.
FIGURE 9.
Lysosome morphology, but not catalytic function, is affected in Pff-td cells. A, Pff-td cells have altered lysosomal morphology. 24 h after Pff transduction, cells were treated for 24 h with a lysosomal protease inhibitor mixture (Lysosome Inh.) or vehicle (−). The IF images show examples of giant (>2.5 μm in diameter) Lamp1-positive (green) vesicles in Pff-td cells (arrowheads). Quantification of giant Lamp1 vesicles, shown as number of vesicles per 100 nuclei (blue), is shown on the right. Pff-td cells harbored significantly more giant lysosomes than PBS-td cells. Lysosomal inhibitor treatment eliminated this difference. Co-localization between p-α-syn (red) and Lamp1 (green) was not observed in the absence or presence of inhibitor treatment. B, lysosome function was not affected in Pff-td cells. The fluorogenic lysosomal substrate, Magic Red MR-(RR)2, is cleaved by the lysosomal protease cathepsin-B (Cath-B) to yield a fluorescent product. Both normal lysosomes and the giant lysosomes in Pff-td cells converted the fluorogenic substrate, suggesting that lysosomal function was unaffected by the α-syn aggregates. Treatment with lysosomal inhibitors (top right) diminished lysosomal fluorescence, confirming dependence of Magic Red MR-(RR)2 cleavage on proper lysosome function. C, lysosomal degradation of EGFR is unaffected in Pff-td cells. A representative IB (n ≥3) is shown, which reveals similar EGF-induced EGFR degradation by lysosomes in PBS-td and Pff-td cells 30 and 120 min after addition of EGF. EGFR was not substantially degraded in PBS-td or Pff-td cells in the absence of EGF (EGF −). Cq treatment inhibited EGFR degradation, confirming that the reduction of EGFR after EGF treatment was dependent on lysosome function. Statistical significance was determined with Student's t test. NS, *** indicate p > 0.05, and p < 0.001, respectively. Scale bars, 20 μm.
FIGURE 10.
FIGURE 10.
Autophagosomes associated with p-α-syn aggregates are impaired in maturation. 24 h after PBS or Pff transduction, HEK293 α-syn cells were treated for another 24 h with a lysosomal inhibitor mixture (Lysosome Inh.) or vehicle (−) before they were fixed for IF. A, IF images showing CD63 (red), LC3 (green), p-α-syn (blue, white dotted outline), and nuclei (denoted as “Nu”). There were few LC3 and CD63 puncta in PBS-td cells, and these did not co-localize in the absence of lysosomal inhibitor. However, LC3 and CD63 co-localization was observed in the PBS-td cells when the clearance of autophagic vesicles was prevented by lysosomal inhibitor treatment. In Pff-td cells, LC3 vesicles that accumulate with p-α-syn aggregates were not generally co-localized with CD63 vesicles. Inhibition of lysosomes resulted in some overlap of CD63 and LC3, but CD63 did not localize to LC3 vesicles associated with p-α-syn. Although they did not co-localize with the p-α-syn aggregates, CD63 vesicles in Pff-td cells appeared to be larger and more variable in size compared with those in PBS-td cells. B, IF images showing Lamp1 (red), LC3 (green), p-α-syn (blue, white dotted outline), and nuclei (denoted as “Nu”). Lamp1 co-localized with LC3 in PBS-td cells treated with lysosomal inhibitor and in cells without α-syn aggregates in Pff-td cells after addition of lysosome inhibitor. However, Lamp1 was largely excluded from LC3 vesicles that overlapped with α-syn aggregates in Pff-td cells in the absence or presence of lysosome inhibitor. n ≥3 for all experiments. Scale bars, 20 μm.
FIGURE 11.
FIGURE 11.
Treatments that activate autophagy increase the toxicity of α-syn aggregates. A, lactate dehydrogenase release assay was performed to monitor cell death in naive HEK293 cells or HEK293 cells that express α-syn. Only Pff-tdHEK293 α-syn cells (α-syn Pff) showed significantly increased LDH release (n = 2). B, PBS- or Pff-tdHEK293 α-syn cells were maintained in nutrient-rich complete media (comp), treated with rapamycin or maintained in starvation media after transduction, until a tetrazolium-based viability assay was carried out. Both starvation and rapamycin treatment significantly reduced viability in transduced cells (n = 3). C and D, Pff- or PBS-td WT neurons were starved or treated with rapamycin, and the LDH release assay (n = 3) (C) and the viability assay (n = 2) (D) were performed. Starvation significantly increased cell death and decreased viability in neurons, and rapamycin treatment trended toward the same pattern. (Error bars, ±S.E. A and B, one-way ANOVA with Tukey's post hoc analysis used to test for statistically significant differences. C and D, Student's paired t test was used to test for statistically significant differences. NS, *, ** and *** indicate p > 0.05, p < 0.05, p < 0.01, and p < 0.001, respectively.)

References

    1. Spillantini M. G. (1999) Parkinson's disease, dementia with Lewy bodies, and multiple system atrophy are α-synucleinopathies. Parkinsonism Relat. Disord. 5, 157–162 - PubMed
    1. Galvin J. E., Lee V. M., Trojanowski J. Q. (2001) Synucleinopathies: clinical and pathological implications. Arch. Neurol. 58, 186–190 - PubMed
    1. Kuzuhara S., Mori H., Izumiyama N., Yoshimura M., Ihara Y. (1988) Lewy bodies are ubiquitinated. A light and electron microscopic immunocytochemical study. Acta Neuropathol. 75, 345–353 - PubMed
    1. Fujiwara H., Hasegawa M., Dohmae N., Kawashima A., Masliah E., Goldberg M. S., Shen J., Takio K., Iwatsubo T. (2002) α-Synuclein is phosphorylated in synucleinopathy lesions. Nat. Cell Biol. 4, 160–164 - PubMed
    1. Wakabayashi K., Tanji K., Mori F., Takahashi H. (2007) The Lewy body in Parkinson's disease: molecules implicated in the formation and degradation of α-synuclein aggregates. Neuropathology 27, 494–506 - PubMed

Publication types

MeSH terms

Substances