. 2013 Apr;140(8):1621-38.
doi: 10.1242/dev.083519.

Morphogen transport

Affiliations

Morphogen transport

Patrick Müller et al. Development. 2013 Apr.

Abstract

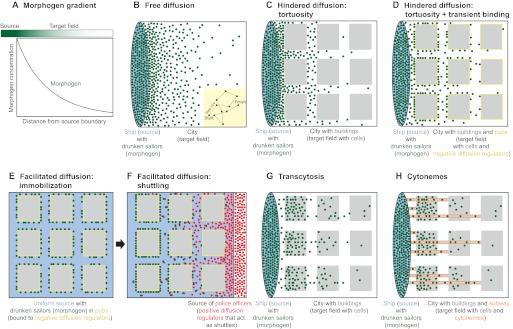
The graded distribution of morphogens underlies many of the tissue patterns that form during development. How morphogens disperse from a localized source and how gradients in the target tissue form has been under debate for decades. Recent imaging studies and biophysical measurements have provided evidence for various morphogen transport models ranging from passive mechanisms, such as free or hindered extracellular diffusion, to cell-based dispersal by transcytosis or cytonemes. Here, we analyze these transport models using the morphogens Nodal, fibroblast growth factor and Decapentaplegic as case studies. We propose that most of the available data support the idea that morphogen gradients form by diffusion that is hindered by tortuosity and binding to extracellular molecules.


Figures

Fig. 1.
Fig. 1.
Morphogen transport and the drunken sailor analogy. (A) The transport of morphogens from a source establishes a gradient in the target field. (B-H) Five major morphogen transport models are illustrated using the drunken sailor analogy, in which drunken sailors move by random walks from a ship into a city. In this analogy, morphogen molecules are represented by sailors and cells are represented by buildings. (B) In the case of free diffusion, sailors (green dots) leave the ship (blue oval) and disperse into the city (white square). Inset: sailors take steps of the indicated fixed size and the direction of each step is random. This ‘random walk’ describes the diffusive behavior of molecules in solution. (C) In the tortuosity-mediated hindered diffusion model, buildings (gray) act as obstacles that sailors must move around, thus increasing the tortuosity of the environment. (D) In the case of diffusion that is hindered by tortuosity and transient binding, the sailors stop in pubs (negative diffusion regulators, yellow) located at the periphery of buildings. Note that, in contrast to effects from tortuosity alone, sailors congregate at the periphery of buildings, and there are relatively few freely moving sailors. (E,F) The shuttling model does not require a localized source of sailors. Instead, sailors are initially present mostly in pubs (negative diffusion regulators, yellow) and uniformly distributed in the city (E). Police officers (positive diffusion regulators, red) disperse from a source on the right side, pick up sailors from pubs and escort them through the city by preventing further pub visits (F). When police officers disappear (not shown), sailors can re-enter the pubs. Over time, this results in the concentration of sailors on the left. (G) In the transcytosis model, the sailors travel through the buildings. (H) During directed transport mediated by cytonemes, the sailors travel through subway tunnels (orange), which deposit the sailors in buildings.
Fig. 2.
Fig. 2.
Gradient formation in models of free diffusion and hindered diffusion. A tissue layer with overlying fluid-filled space covered by a non-responsive roof is used to illustrate the behavior of different diffusion models. This geometry is similar to that found in the Drosophila wing disc (Kornberg and Guha, 2007). Production [P(x)] only occurs in the source, diffusion occurs everywhere, and other reactions are restricted to the source and target field. All models lead to a similar steady state distribution of morphogen in the target field. (A) Free diffusion. In the simplest model, morphogen (c; green) is produced, diffuses freely with diffusivity D, and is degraded rapidly with a clearance rate constant k1. The gradient of c rapidly reaches steady state. In an extended model, c1 is cleared rapidly by trapping (irreversible binding or cellular uptake), converting c1 into an immobile population c2, which is degraded slowly with the degradation rate constant k1. The immobilized species (c2; blue) rather than the extracellular species (c1; green) dominates the slow gradient formation dynamics. (B) In the binding-mediated hindered diffusion model, morphogen diffuses and transiently binds to immobilized diffusion regulators (R; yellow). Thus, although molecules have high local diffusivities, their effective global diffusivity is low. The majority of morphogen is present in a form that is bound to diffusion regulators (formula image
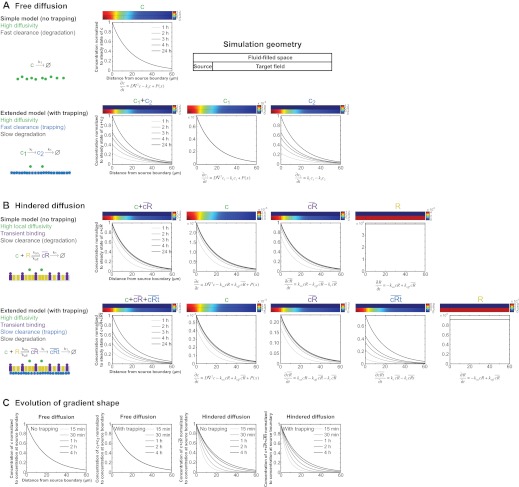
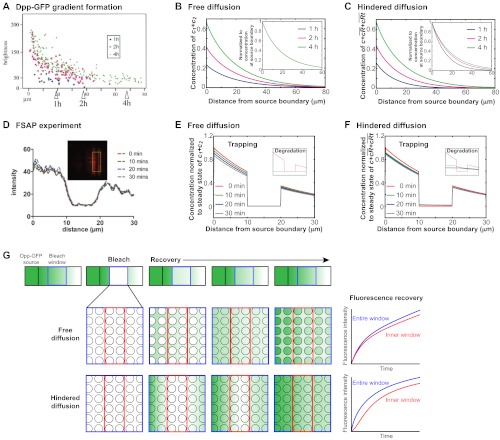
; purple), which leads to the concentration of morphogen in the tissue layer and to exclusion from the fluid-filled space. In an extended model, formula image is converted into an irreversibly trapped fraction, formula image, with a clearance rate constant kt. formula image is degraded with a degradation rate constant k1. In both the free and hindered diffusion models, the free extracellular concentration of morphogens is low. (C) The free and hindered diffusion models can lead to the same steady state morphogen distribution but predict distinct gradient formation kinetics. The free diffusion model predicts rapid progression to the final shape of the distribution, whereas hindered diffusion models predict slow progression. Shown are the curves from the first graphs in A and B normalized to the respective concentrations at the source boundary. Simulations were performed similar to those of Müller et al. (Müller et al., 2012) using a two-dimensional geometry of 200 μm length and 12 μm height; source width of 10 μm; fluid-filled space height of 6 μm; no-flux boundary conditions; initial morphogen concentrations of zero; concentration gradients were sampled in the middle of the target field at a height of 3 μm. Parameters used: (A) simple model, D=20 μm2/s, k1=0.1/s; extended model, D=20 μm2/s, kt=0.1/s, k1=0.000076/s; (B) simple model, D=20 μm2/s, kon=0.001/(nM·s), koff=0.021/s, k1=0.00024/s, initial concentration of R in source and target field Rinit=10 μM [kon, koff and Rinit were chosen based on values in the literature (Dowd et al., 1999; Umulis et al., 2009)]; extended model, D=20 μm2/s, kon=0.001/(nM·s), koff=0.021/s, kt=0.00024/s, k1=0.000076/s, Rinit=10 μM. In all models, production of the mobile morphogen only occurred in the source at a constant rate of v=0.2 pM/s. The source and target field were modeled without the effects of cells and tortuosity. Tortuosity could reduce the values of D that were used in the models, and the clearance rate and off-rate constants would change accordingly.
Fig. 3.
Fig. 3.
Model of Nodal and Lefty transport by hindered diffusion. (A) Nodal (green) and Lefty (blue) have different signaling ranges and form an activator-inhibitor reaction-diffusion system [modified with permission (Müller et al., 2012)]. Nodal induces signaling at short range due to its low diffusivity, whereas Lefty inhibits Nodal signaling at long range due to its high diffusivity. (B,C) Mathematical modeling indicates that Nodal (B) might bind to extracellular molecules (yellow) with higher affinity than Lefty (C). This would lead to the decreased global diffusivity of Nodal, whereas Lefty moves relatively freely through the tissue (Müller et al., 2012).
Fig. 4.
Fig. 4.
FGF8 gradient formation dynamics and the hindered diffusion model. (A) FGF8-GFP gradient formation dynamics [reproduced with permission (Yu et al., 2009)]. Different colors indicate different developmental stages. In B and C, simulation times were chosen to roughly correspond to the developmental stages measured in A. (B) The hindered diffusion model predicts that the gradient emerges slowly over time and qualitatively describes gradient formation similar to that observed in vivo. (C) By contrast, the free diffusion model predicts that the gradient rapidly (within the first 30 minutes) reaches values close to the steady state distribution. Simulations were performed similar to those of Müller et al. (Müller et al., 2012) using a two-dimensional geometry similar to the geometry described by Yu et al. (Yu et al., 2009). The embryo was modeled as a disc of radius 310 μm containing a concentric source of radius 85 μm, where morphogen is produced at a constant rate; diffusion and reactions occurred in all domains. The equations for the free and hindered diffusion models without trapping shown in Fig. 2 were used. Parameters used: (B) D=50 μm2/s, kon=0.001/(nM·s), koff=0.065/s, k1=0.00001/s, Rinit =1 μM; (C) D=50 μm2/s, k1=0.0013/s. Production of the mobile morphogen only occurred in the source at a constant rate of v=0.2 pM/s in all models. Given the homogenous distribution of the binding partner R in this geometry (in contrast to the simulations in Figs 2 and 5, which assume an absence of R in the fluid-filled space), the effective global diffusion coefficient Deff can be calculated from the local free diffusion coefficient D and the binding kinetics as: Source and target field were modeled without the effects of cells and tortuosity. (D) Model for FGF transport by hindered diffusion and the effects of heparin injection on FGF8-GFP localization. FGF8-GFP (green) is seen on the cell surface of early zebrafish embryos (left panel; membranes are labeled with membrane-RFP, red). These clusters can be disrupted by injection of 500 pg heparin into the extracellular space at blastula stages (right). The diffuse FGF8-GFP pool in heparin-injected embryos has a dramatically increased diffusion coefficient, suggesting that transient binding to HSPGs might hinder diffusion.
Fig. 5.
Fig. 5.
Dpp gradient formation. (A) Dpp-GFP gradient formation dynamics [reproduced with permission (Entchev et al., 2000)]. (B,C) Gradient formation dynamics predicted by hindered and free diffusion models with trapping in the geometry shown in Fig. 2. Both models appear to fit the data well. Insets show evolution of gradient shape similar to Fig. 2C, normalized to the steady state concentration at the source boundary. Parameters used: (B) D=20 μm2/s, kin=0.1/s, k1=0.000076/s; (C) D=20 μm2/s, kon=0.001/(nM·s), koff=0.021/s, kin=0.00024/s, k1=0.000076/s, Rinit=10 μM. Production of mobile morphogen only occurred in the source at a constant rate of v=0.2 pM/s in all models. (D) Dpp FSAP [reproduced with permission (Zhou et al., 2012)]. Two parallel stripes in wing discs expressing Dpp-Dendra2 were photoconverted (red), and the photoconverted signal fails to spread. Surprisingly, the fluorescence from pulse-labeled Dpp in FSAP experiments increased, rather than decreased, over time (not shown) (Zhou et al., 2012). (E,F) FSAP predicted by free (E) and hindered (F) diffusion models with or without clearance by trapping (irreversible binding or cellular uptake) was simulated in a geometry similar to that shown in Fig. 2, except that no new production occurred and that the concentrations of all species were set close to their steady state values in the two photoactivated regions (each 10 μm wide and encompassing both the target field and the fluid-filled space; stripe 1, adjacent to the source boundary; stripe 2, 20 μm away from the source boundary) and to zero everywhere else as the initial condition. Both models that include clearance by trapping appear to fit the data well, and the signal fails to spread due to the long half-life of immobile Dpp combined with the low fraction of mobile molecules. By contrast, the outcomes of models with clearance by degradation (insets) do not resemble the data shown in D. All models with the chosen parameter values led to gradients that attained “50% of their long-time (100+ hour) values within 8 hours after initiation from initial conditions of zero in all compartments” and are thus biologically plausible as defined by Zhou et al. (Zhou et al., 2012). Furthermore, similar to experimental results of Kicheva et al. (Kicheva et al., 2007), the system and parameters used in the hindered diffusion models lead to a large ‘immobile fraction’ and result in a recovery delay between large and small analysis windows in nested FRAP simulations (not shown). Parameters used: free diffusion and no trapping, D=20 μm2/s, k1=0.1/s; free diffusion with trapping, D=20 μm2/s, kt=0.1/s, k1=0.000076/s; hindered diffusion with no trapping, D=20 μm2/s, kon=0.001/(nM·s), koff=0.021/s, k1=0.00024/s, Rinit=10 μM; hindered diffusion with trapping, D=20 μm2/s, kon=0.001/(nM·s), koff=0.021/s, kt=0.00024/s, k1=0.000025/s, Rinit=10 μM. In all models, production of the mobile morphogen only occurred in the source at a constant rate of v=0.2 pM/s. Source and target field were modeled without the effects of cells and tortuosity. (G) Schematic of Dpp-GFP nested FRAP (Kicheva et al., 2007; Zhou et al., 2012), comparing fluorescence recovery in a smaller nested window (red) to recovery in the total window (blue). In the free diffusion model, Dpp-GFP quickly diffuses into the bleached region, creating a gradient of low levels of mobile molecules. Over time, permanent trapping in or on cells (circles) results in the accumulation of Dpp-GFP. Because diffusion is fast, no strong recovery delay is predicted; recovery is dominated by binding and degradation kinetics and not by diffusion. By contrast, in the hindered diffusion model, Dpp-GFP moves in from the edge of the bleached window and transiently binds diffusion regulators (not shown), which slows Dpp-GFP and causes fluorescence to recover slowly from the window edge. Here, recovery kinetics are dominated by low effective diffusivity. In both models, the average intensity in the total window at steady state will be higher than in the nested window, as the large window includes a brighter portion of the gradient.
Fig. 6.
Fig. 6.
Retention of diffusing morphogen molecules in the plane of the target tissue. (A) Binding interactions can retain the majority of morphogen molecules within the plane of an epithelium, even if movement is not restricted to the plane. This effect is illustrated using the drunken sailor analogy. When sailors (morphogen, green) encounter a strip of pubs (epithelium, gray) located near an open field (fluid-filled space), sailors associate with pubs (yellow). Even though the sailors’ movement is not restricted to the strip, their movement is hindered once inside a pub and most of the sailors are found in pubs over time rather than in the open field. (B,C) A gradient of sailors can form when there is a local source of sailors. Retention of morphogen molecules in the plane of the epithelium could be caused by binding to the cell surface (B) or by cellular uptake (C).
Fig. 7.
Fig. 7.
Cytoneme-mediated morphogen gradient formation. (A) In the cytoneme model, cells project filopodia (pink and orange lines) toward the morphogen source (dark green) and transport morphogen from the source to the cell body. It is possible that cells closer to the source have more cytonemes that contact the source than cells farther away and can thereby establish a gradient in the target tissue even if transport rates in the cytonemes are fast. (B) Cytonemes extend toward morphogen sources. An ectopic source can compete with the endogenous morphogen source to attract cytonemes. In the absence of a morphogen source or in the presence of a uniform morphogen concentration, cells only develop short, randomly oriented cytonemes (Ramírez-Weber and Kornberg, 1999; Hsiung et al., 2005; Roy et al., 2011). (C) Testing the cytoneme model. The cytoneme model predicts that the short, randomly oriented filopodia resulting from uniform expression of unlabeled Dpp should preclude long-range gradient formation of fluorescent Dpp-GFP expressed from a local source (outcome 1). By contrast, if Dpp transport does not depend on cytonemes, the Dpp-GFP gradient should still form when unlabeled Dpp is uniformly expressed (outcome 2).
Fig. 8.
Fig. 8.
Transport by facilitated diffusion. (A) In early Drosophila embryos, Dpp is expressed in a broad dorsolateral domain (blue), but the Dpp protein gradient (green) peaks dorsally. The putative Dpp shuttling molecule Sog (red) is expressed ventrolaterally and is thought to concentrate Dpp dorsally using the shuttling mechanism described in Fig. 1E,F. (B,C) Spätzle patterns the dorsal-ventral axis in Drosophila before the onset of the Dpp patterning system. It has recently been proposed that the Spätzle system self-organizes to generate an effective source of shuttling molecules, although the shuttle is produced within the morphogen domain (Haskel-Ittah et al., 2012). (B) Spätzle is produced in a broad ventral domain (blue), but signaling is highest in a narrow ventral stripe (reviewed by Moussian and Roth, 2005). (C) Spätzle is produced as a precursor protein that is cleaved into a mature domain (green) and a prodomain (red). Both are postulated to be produced ventrally initially (I). The mature domain activates signaling, whereas the prodomain inhibits signaling and has been suggested to diffuse more quickly than the mature domain (Morisato, 2001). The prodomain and the mature domain can reassociate (Haskel-Ittah et al., 2012) and, based on mathematical modeling, it has been proposed that the reassociated complex is more diffusive than the mature domain and that the prodomain is quickly degraded when recomplexed, thereby locally depositing the immobile mature domain (Haskel-Ittah et al., 2012). This leads to depletion of the prodomain wherever the mature domain is present and thus creates higher levels of the prodomain outside of the Spätzle production domain (II). The higher levels of prodomain that are generated in lateral domains over time effectively constitute a source of positive diffusion regulators that shuttle the mature domain into a sharp ventral stripe (III) (Haskel-Ittah et al., 2012). Direct biophysical measurements of diffusion and shuttling of Spätzle are currently lacking, and an alternative system that assumes conversion (and thus depletion) of highly diffusive precursor molecules into less mobile signaling activators can also account for many of the patterning properties of the Spätzle system (Meinhardt, 2004).
None
None
None
None

References

    1. Abu-Arish A., Porcher A., Czerwonka A., Dostatni N., Fradin C. (2010). High mobility of bicoid captured by fluorescence correlation spectroscopy: implication for the rapid establishment of its gradient. Biophys. J. 99, L33–L35 - PMC - PubMed
    1. Akiyama T., Kamimura K., Firkus C., Takeo S., Shimmi O., Nakato H. (2008). Dally regulates Dpp morphogen gradient formation by stabilizing Dpp on the cell surface. Dev. Biol. 313, 408–419 - PMC - PubMed
    1. Ayers K. L., Gallet A., Staccini-Lavenant L., Thérond P. P. (2010). The long-range activity of Hedgehog is regulated in the apical extracellular space by the glypican Dally and the hydrolase Notum. Dev. Cell 18, 605–620 - PubMed
    1. Baeg G. H., Selva E. M., Goodman R. M., Dasgupta R., Perrimon N. (2004). The Wingless morphogen gradient is established by the cooperative action of Frizzled and Heparan Sulfate Proteoglycan receptors. Dev. Biol. 276, 89–100 - PubMed
    1. Beck S., Le Good J. A., Guzman M., Ben Haim N., Roy K., Beermann F., Constam D. B. (2002). Extraembryonic proteases regulate Nodal signalling during gastrulation. Nat. Cell Biol. 4, 981–985 - PubMed

Publication types

MeSH terms