. 2013 Jul;31(7):1330-9.
doi: 10.1002/stem.1377.

Endogenous distal airway progenitor cells, lung mechanics, and disproportionate lobar growth following long-term postpneumonectomy in mice

Affiliations

Endogenous distal airway progenitor cells, lung mechanics, and disproportionate lobar growth following long-term postpneumonectomy in mice

Philip Eisenhauer et al. Stem Cells. 2013 Jul.

Abstract

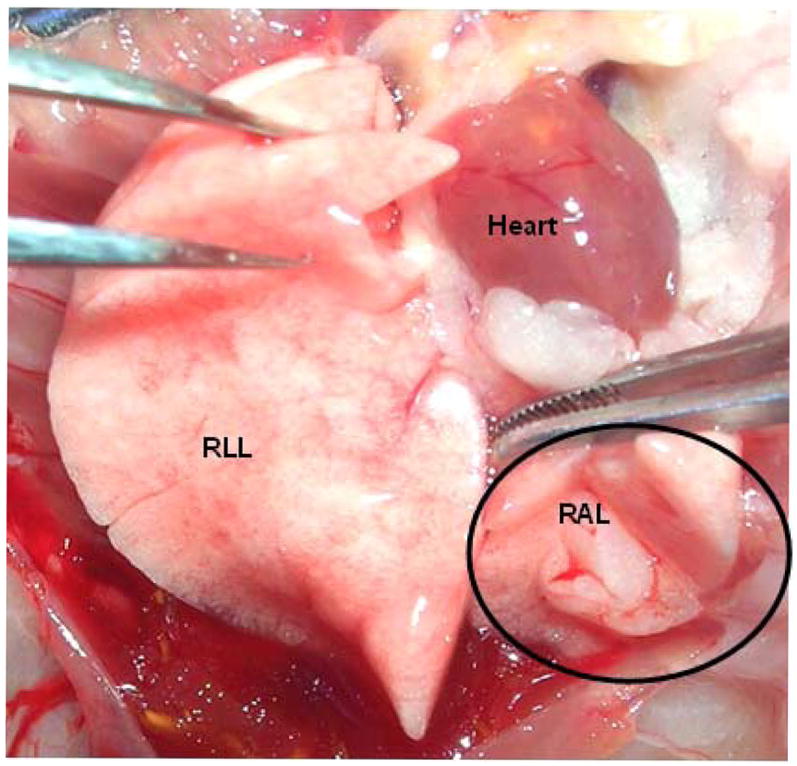
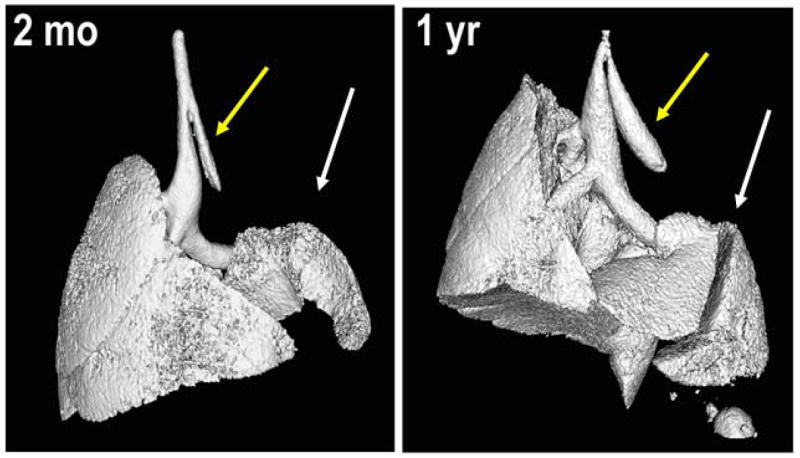
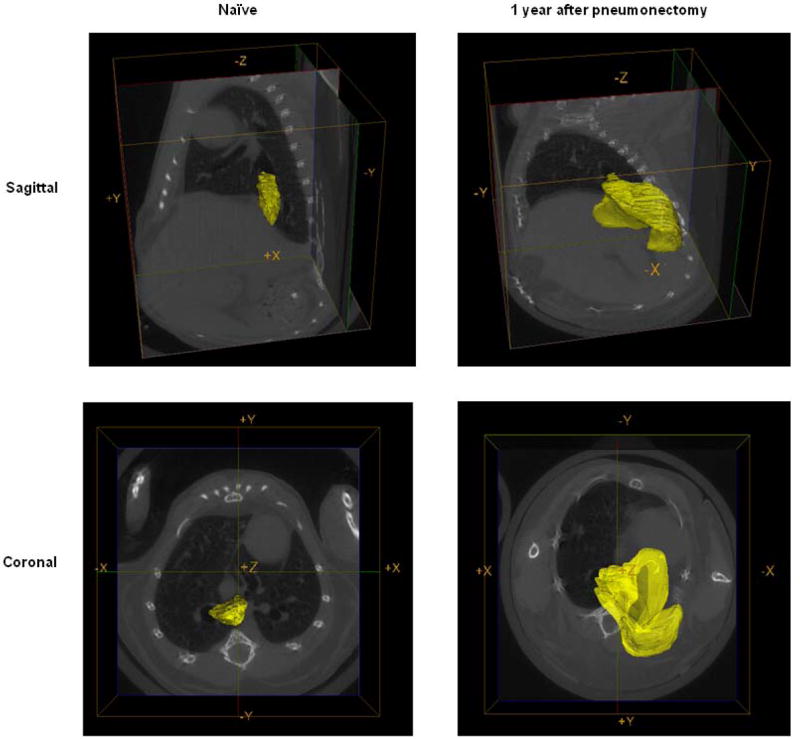
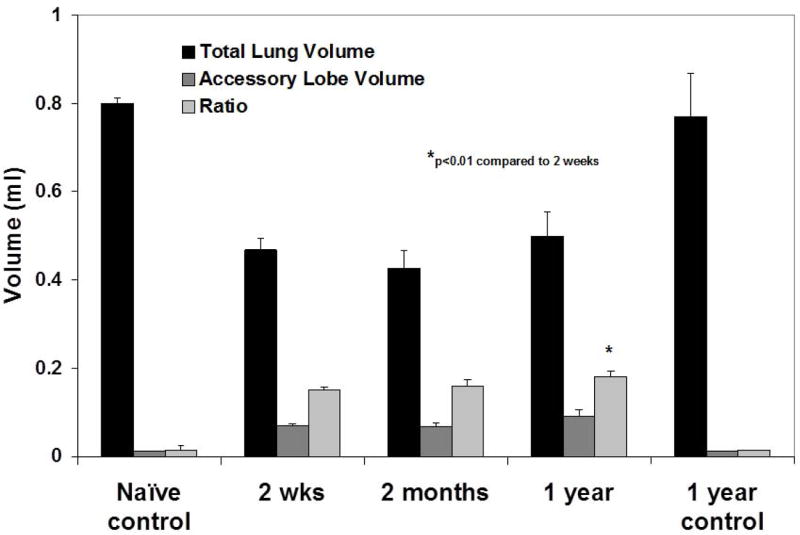
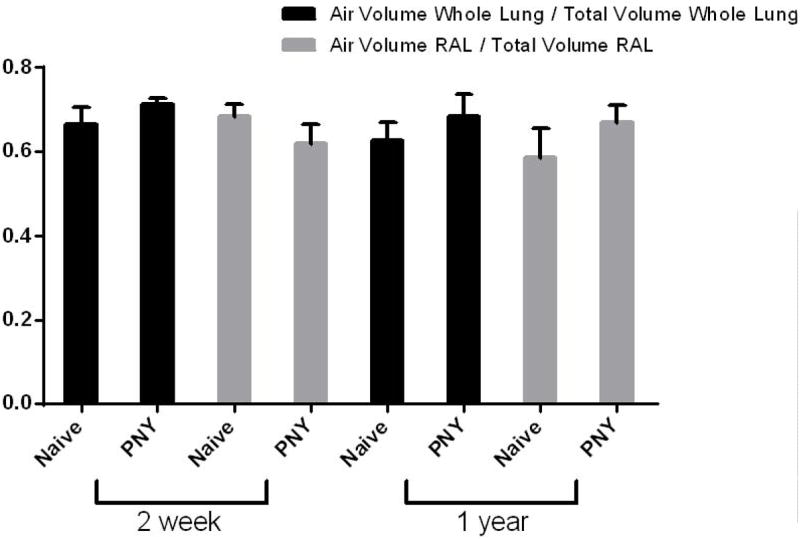
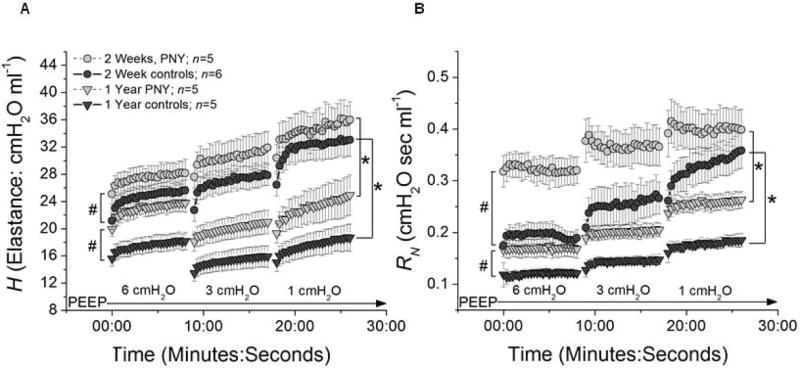
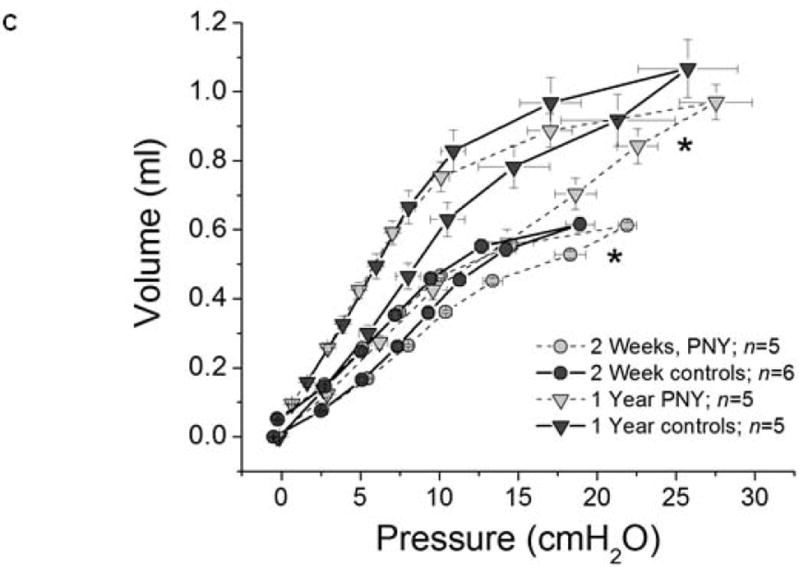
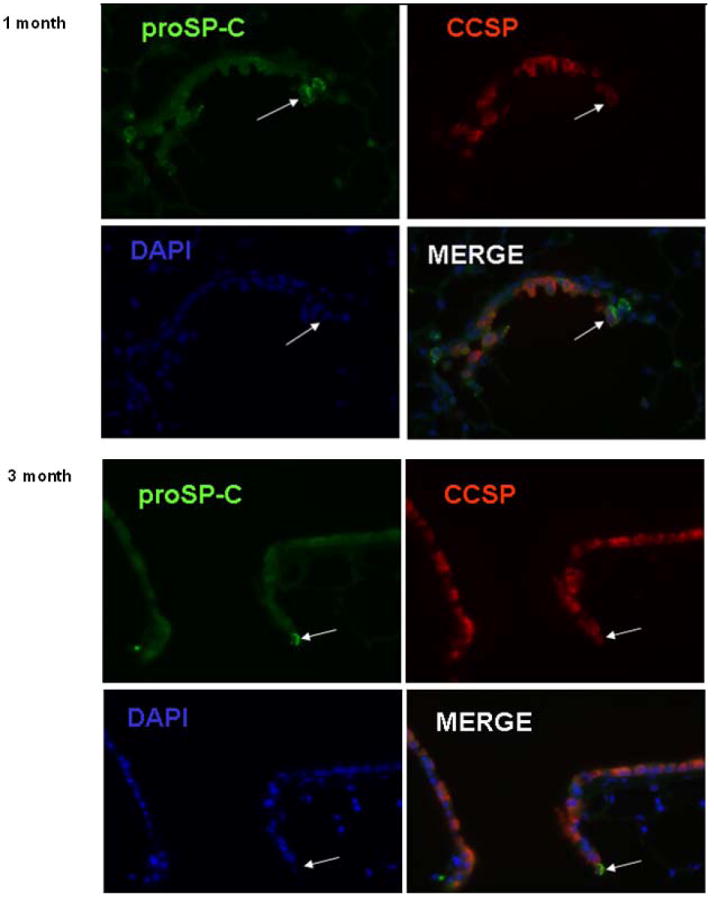
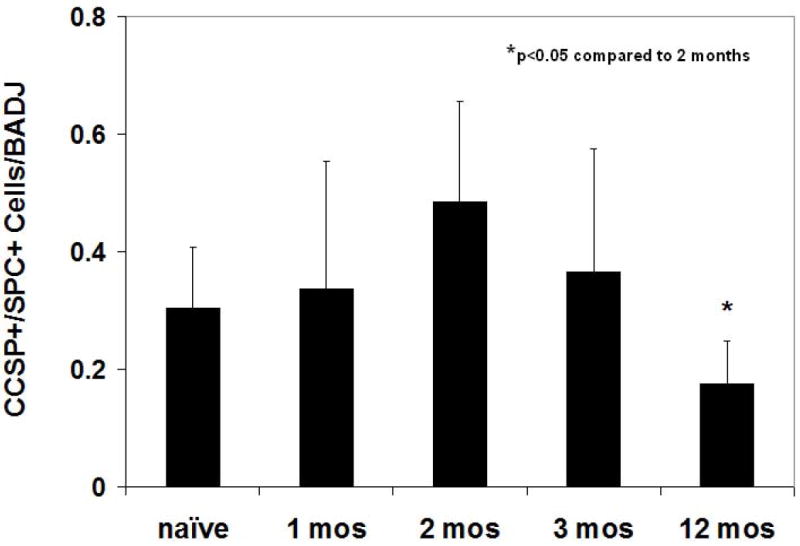
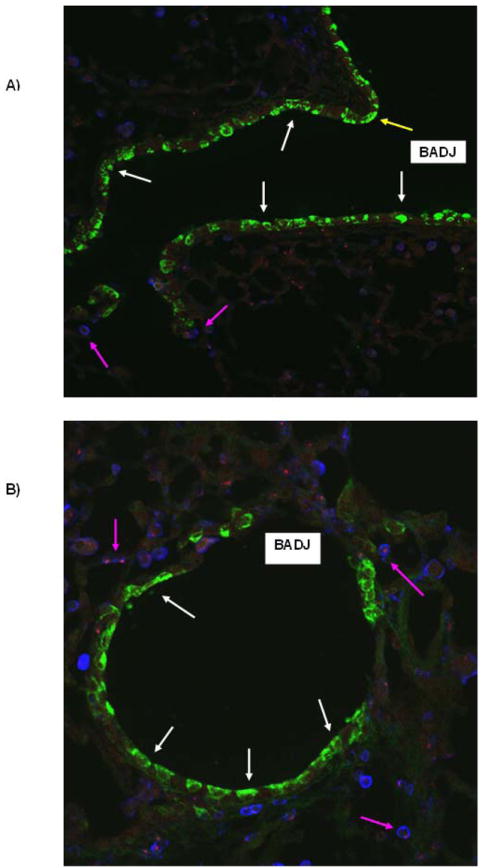
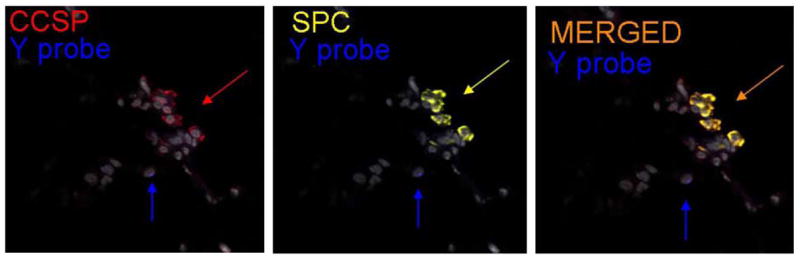
Using a model of postpneumonectomy (PNY) compensatory lung growth in mice, we previously observed an increase in numbers of a putative endogenous distal airway progenitor cell population (CCSP(pos) /pro-SPC(pos) cells located at bronchoalveolar duct junctions [BADJs]), at 3, 7, and 14 days after pneumonectomy, returning to baseline at 28 days post-PNY. As the origin of these cells is poorly understood, we evaluated whether bone marrow cells contributed to the pool of these or other cells during prolonged post-PNY lung regrowth. Naïve and sex-mismatched chimeric mice underwent left PNY and were evaluated at 1, 2, and 3 months for numbers of BADJ CCSP(pos) /pro-SPC(pos) cells and presence of donor-derived marrow cells engrafted as airway or alveolar epithelium. Nonchimeric mice were also examined at 12 months after PNY for numbers of BADJ CCSP(pos) /pro-SPC(pos) cells. Notably, the right accessory lobe (RAL) continued to grow disproportionately over 12 months, a novel finding not previously described. Assessment of lung mechanics demonstrated an increase in lung stiffness following PNY, which significantly diminished over 1 year, but remained elevated relative to 1-year-old naïve controls. However, the number of CCSP(pos) /pro-SPC(pos) BADJ cells ≥1-month following PNY was equivalent to that found in naïve controls even after 12 months of continued RAL growth. Notably, no donor bone marrow-derived cells engrafted as airway or alveolar epithelial cells, including those at the BADJ, up to 3 months after PNY. These studies suggest that lung epithelial cells, including CCSP(pos) /pro-SPC(pos) cells, are not replenished from marrow-derived cells during post-PNY lung growth in mice.

Keywords: Bronchioalveolar stem cell; Lung regeneration; Postpneumonectomy lung growth; Progenitor cell.


Figures

Figure 1
Figure 1
A: Representative photograph taken at necropsy 1 year after pneumonectomy demonstrates substantial growth of the right accessory lobe. RLL = right lower lobe; RAL = right accessory lobe. The circle outlines the RAL. B: Representative isosurface renderings of the CT scans at 2 months and at 1 year following left pneumonectomy demonstrates growth and expansion of right lower lobe into left chest cavity (white arrows). Yellow arrows indicate the residual left main stem bronchus. Scans represent typical results obtained in 6 mice evaluated at 2 months and 7 mice evaluated 1 year after pneumonectomy. C: Representative reconstructive regions of interest on the CT scans highlighting the right accessory lobe (yellow) one year after pneumonectomy and in an age-matched naïve control mouse.
Figure 1
Figure 1
A: Representative photograph taken at necropsy 1 year after pneumonectomy demonstrates substantial growth of the right accessory lobe. RLL = right lower lobe; RAL = right accessory lobe. The circle outlines the RAL. B: Representative isosurface renderings of the CT scans at 2 months and at 1 year following left pneumonectomy demonstrates growth and expansion of right lower lobe into left chest cavity (white arrows). Yellow arrows indicate the residual left main stem bronchus. Scans represent typical results obtained in 6 mice evaluated at 2 months and 7 mice evaluated 1 year after pneumonectomy. C: Representative reconstructive regions of interest on the CT scans highlighting the right accessory lobe (yellow) one year after pneumonectomy and in an age-matched naïve control mouse.
Figure 2
Figure 2
A: Quantitative assessment of the total lung volumes from the CT scans demonstrates disproportionate growth of the right accessory lobe over one year post-pneumonectomy. Values represent means ± standard deviations from 3 (naïve 2 week control, naïve 1 year control), 6 (2 month PNMO), or 7 (2 week PNMO, 1 year PNMO) representative mice assessed at each time point. B: Assessment of air and total lung volumes demonstrates similar ratios of air/total volumes at both 2 weeks and 1 year post-pneumonectomy compared to each other and to naïve age-matched controls. Values represent means ± standard deviations from 6 (1 year naive), 7 (2 weeks PNY, 1 year PNY), or 8 (2 week naïve) mice assessed at each time point. RAL = Right accessory lobe.
Figure 2
Figure 2
A: Quantitative assessment of the total lung volumes from the CT scans demonstrates disproportionate growth of the right accessory lobe over one year post-pneumonectomy. Values represent means ± standard deviations from 3 (naïve 2 week control, naïve 1 year control), 6 (2 month PNMO), or 7 (2 week PNMO, 1 year PNMO) representative mice assessed at each time point. B: Assessment of air and total lung volumes demonstrates similar ratios of air/total volumes at both 2 weeks and 1 year post-pneumonectomy compared to each other and to naïve age-matched controls. Values represent means ± standard deviations from 6 (1 year naive), 7 (2 weeks PNY, 1 year PNY), or 8 (2 week naïve) mice assessed at each time point. RAL = Right accessory lobe.
Figure 3
Figure 3
Assessment of lung mechanics demonstrates decreased stiffness over one year after pneumonectomy, consistent with continued lung growth. A) Mean values (+/- SEM) of respiratory elastance (H) plotted against time at a PEEP level of 6, 3, and 1 cm H2O for mice at two weeks after PNY (grey circles), one year after PNY (light grey triangles), and in age matched controls at 2 weeks (dark grey circles) and one year (dark grey circles). B) Mean values (+/- SEM) of airways resistance (RN) plotted against time at a PEEP level of 6, 3, and 1 cm H2O, utilizing the same key for groups as in A. For both panels, # signifies a significant difference between PNY and age-matched controls in ending values of H across all levels of PEEP (ANOVA, p<0.05). * signifies a significant difference between 2 weeks and one year in ending values of H across all levels of PEEP (ANOVA, p<0.05). C) Mean values (+/- SEM) of piston volume (ml) plotted against matching mean values of airway opening pressure (cmH2O) following 8 minutes ventilation at PEEP of 1 cm H2O for mice at two weeks after PNY (grey circles), one year after PNY (light grey triangles), and in age matched controls at 2 weeks (dark grey circles) and one year (dark grey circles). * signifies a significant difference between PNY and age-matched controls in mean airway pressure values across the entire inspiratory limb (right side) of the pressure-volume loop, a surrogate for lung stiffness (ANOVA, p<0.05). Values represent results from 3-7 representative mice assessed at each time point.
Figure 3
Figure 3
Assessment of lung mechanics demonstrates decreased stiffness over one year after pneumonectomy, consistent with continued lung growth. A) Mean values (+/- SEM) of respiratory elastance (H) plotted against time at a PEEP level of 6, 3, and 1 cm H2O for mice at two weeks after PNY (grey circles), one year after PNY (light grey triangles), and in age matched controls at 2 weeks (dark grey circles) and one year (dark grey circles). B) Mean values (+/- SEM) of airways resistance (RN) plotted against time at a PEEP level of 6, 3, and 1 cm H2O, utilizing the same key for groups as in A. For both panels, # signifies a significant difference between PNY and age-matched controls in ending values of H across all levels of PEEP (ANOVA, p<0.05). * signifies a significant difference between 2 weeks and one year in ending values of H across all levels of PEEP (ANOVA, p<0.05). C) Mean values (+/- SEM) of piston volume (ml) plotted against matching mean values of airway opening pressure (cmH2O) following 8 minutes ventilation at PEEP of 1 cm H2O for mice at two weeks after PNY (grey circles), one year after PNY (light grey triangles), and in age matched controls at 2 weeks (dark grey circles) and one year (dark grey circles). * signifies a significant difference between PNY and age-matched controls in mean airway pressure values across the entire inspiratory limb (right side) of the pressure-volume loop, a surrogate for lung stiffness (ANOVA, p<0.05). Values represent results from 3-7 representative mice assessed at each time point.
Figure 4
Figure 4
Representative photomicrographs of mouse lungs depicting dual labeled BADJ CCSPpos / pro-SPCpos cells either 1 (A) or 3 (B) months after pneumonectomy. Individual staining and the merged images are shown. Similar results were observed in mouse lungs evaluated at 2 or 12months after pneumonectomy. Values represent results from 3-6 representative mice assessed at each time point. Original Magnification 400×.
Figure 5
Figure 5
No significant increase in numbers of BADJ CCSPpos / pro-SPCpos cells over those found in naïve control lungs was observed in lungs assessed 1,2,3, or 12 months post-pneumonectomy. Bars represent means + standard deviations of 16-30 BADJ counted on each of 15-20 serial sections of each mouse lung. N = 3-7 mice for each experimental condition. *p<0.05 compared to 2 months.
Figure 6
Figure 6
No obvious airway epithelial chimerism was observed up to 3 months after pneumonectomy in sex-mismatched chimeric mice. A) Low power view demonstrating an airway branch point (yellow arrow) and a bronchoalveolar duct junction (BADJ) (original mag 100×). B) Higher power view of a terminal bronchiole and BADJ (original mag 200×). White arrows: CCSP+ (green) airway epithelial cells; Pink arrows: CD45+ (blue) leukocytes, the majority of which were also FISH positive for the Y chromosome (red). C) Higher power view of a BADJ showing a donor derived leukocyte (FISH positive for the Y chromosome, blue, blue arrow) and individual and merged images of CCSP+ and SPC+ cells. No obvious donor-derived dual positive BADJ CCSP+ or SPC+ cells were observed (original mag 400×). Values represent results from 3-6 representative mice assessed at each time point.
Figure 6
Figure 6
No obvious airway epithelial chimerism was observed up to 3 months after pneumonectomy in sex-mismatched chimeric mice. A) Low power view demonstrating an airway branch point (yellow arrow) and a bronchoalveolar duct junction (BADJ) (original mag 100×). B) Higher power view of a terminal bronchiole and BADJ (original mag 200×). White arrows: CCSP+ (green) airway epithelial cells; Pink arrows: CD45+ (blue) leukocytes, the majority of which were also FISH positive for the Y chromosome (red). C) Higher power view of a BADJ showing a donor derived leukocyte (FISH positive for the Y chromosome, blue, blue arrow) and individual and merged images of CCSP+ and SPC+ cells. No obvious donor-derived dual positive BADJ CCSP+ or SPC+ cells were observed (original mag 400×). Values represent results from 3-6 representative mice assessed at each time point.

References

    1. Borthwick DW, Shahbazian M, Krantz QT, Dorin JR, Randell SH. Evidence for stem-cell niches in the tracheal epithelium. Am J Respir Cell Mol Biol. 2001;24:662–70. - PubMed
    1. Daniely Y, Liao G, Dixon D, Linnoila RI, Lori A, Randell SH, et al. Critical role of p63 in the development of a normal esophageal and tracheobronchial epithelium. Am J Physiol Cell Physiol. 2004;287:C171–81. - PubMed
    1. Schoch KG, Lori A, Burns KA, Eldred T, Olsen JC, Randell SH, et al. A subset of mouse tracheal epithelial basal cells generates large colonies in vitro. Am J Physiol Lung Cell Mol Physiol. 2004;286:L631–42. - PubMed
    1. Rock JR, Onaitis MW, Rawlins EL, Lu Y, Clark CP, Xue Y, et al. Basal cells as stem cells of the mouse trachea and human airway epithelium. Proc Natl Acad Sci USA. 2009;106:12771–5. - PMC - PubMed
    1. Hong KU, Reynolds SD, Watkins S, Fuchs E, Stripp BR. In vivo differentiation potential of basal cells: Evidence for multipotent and unipotent subpopulations. Am J Physiol Lung Cell Mol Physiol. 2004;286:L643–9. - PubMed

Publication types