. 2013:2013:897025.
doi: 10.1155/2013/897025. Epub 2013 Feb 28.

Mammalian target of rapamycin inhibitors induce tumor cell apoptosis in vivo primarily by inhibiting VEGF expression and angiogenesis

Affiliations

Mammalian target of rapamycin inhibitors induce tumor cell apoptosis in vivo primarily by inhibiting VEGF expression and angiogenesis

Patrick Frost et al. J Oncol. 2013.

Abstract

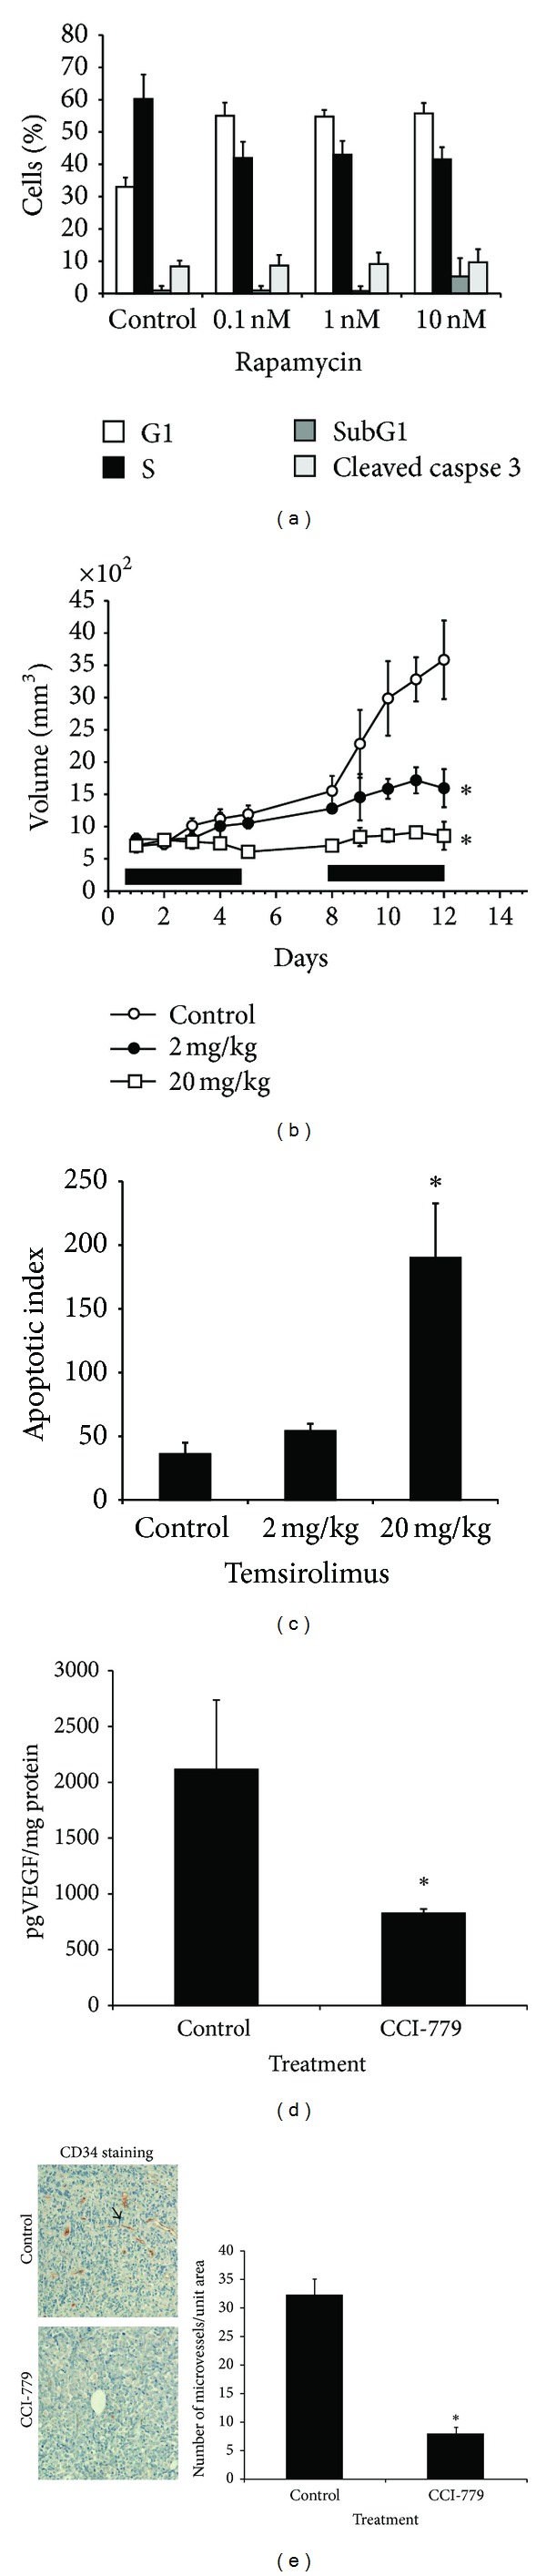
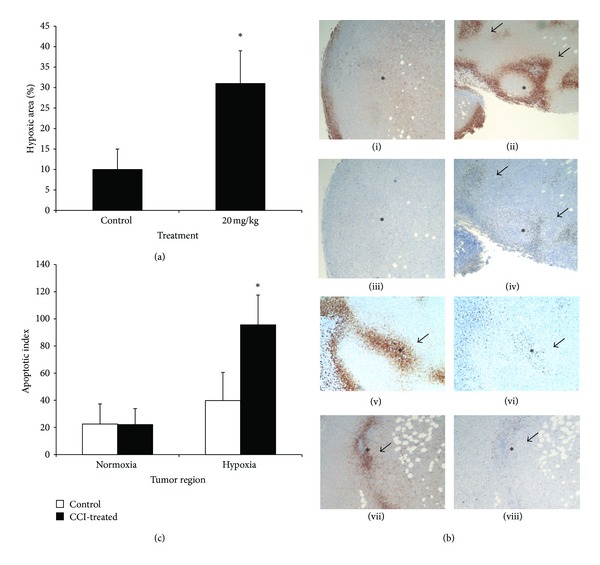
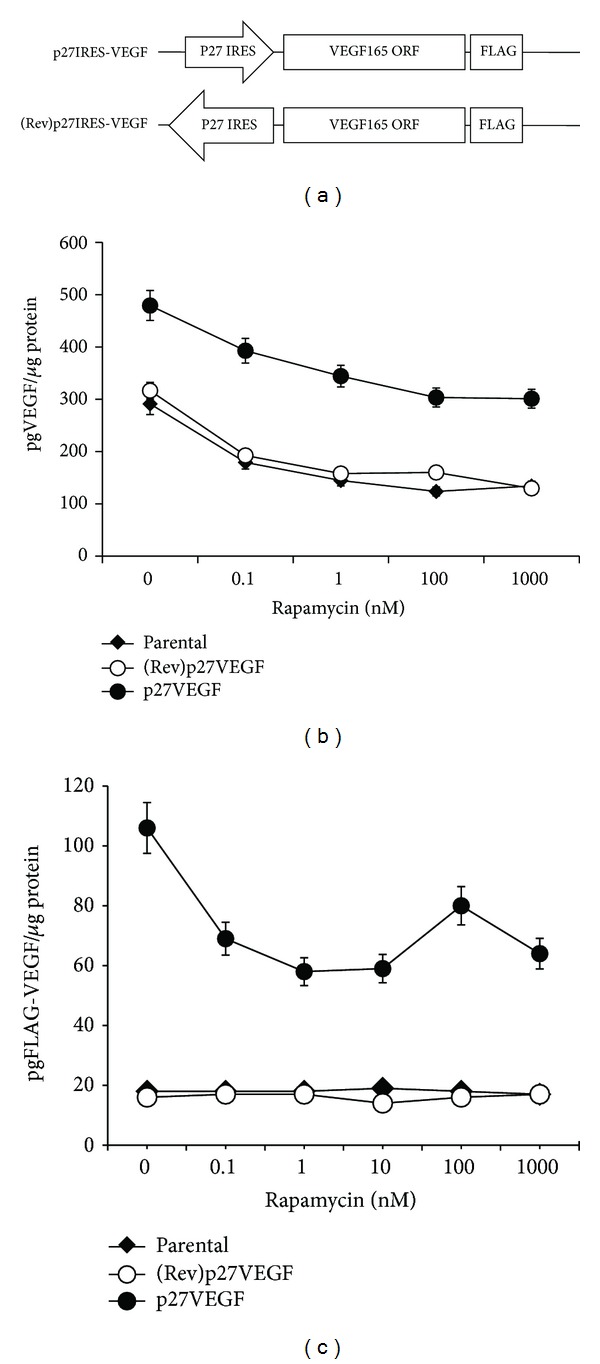
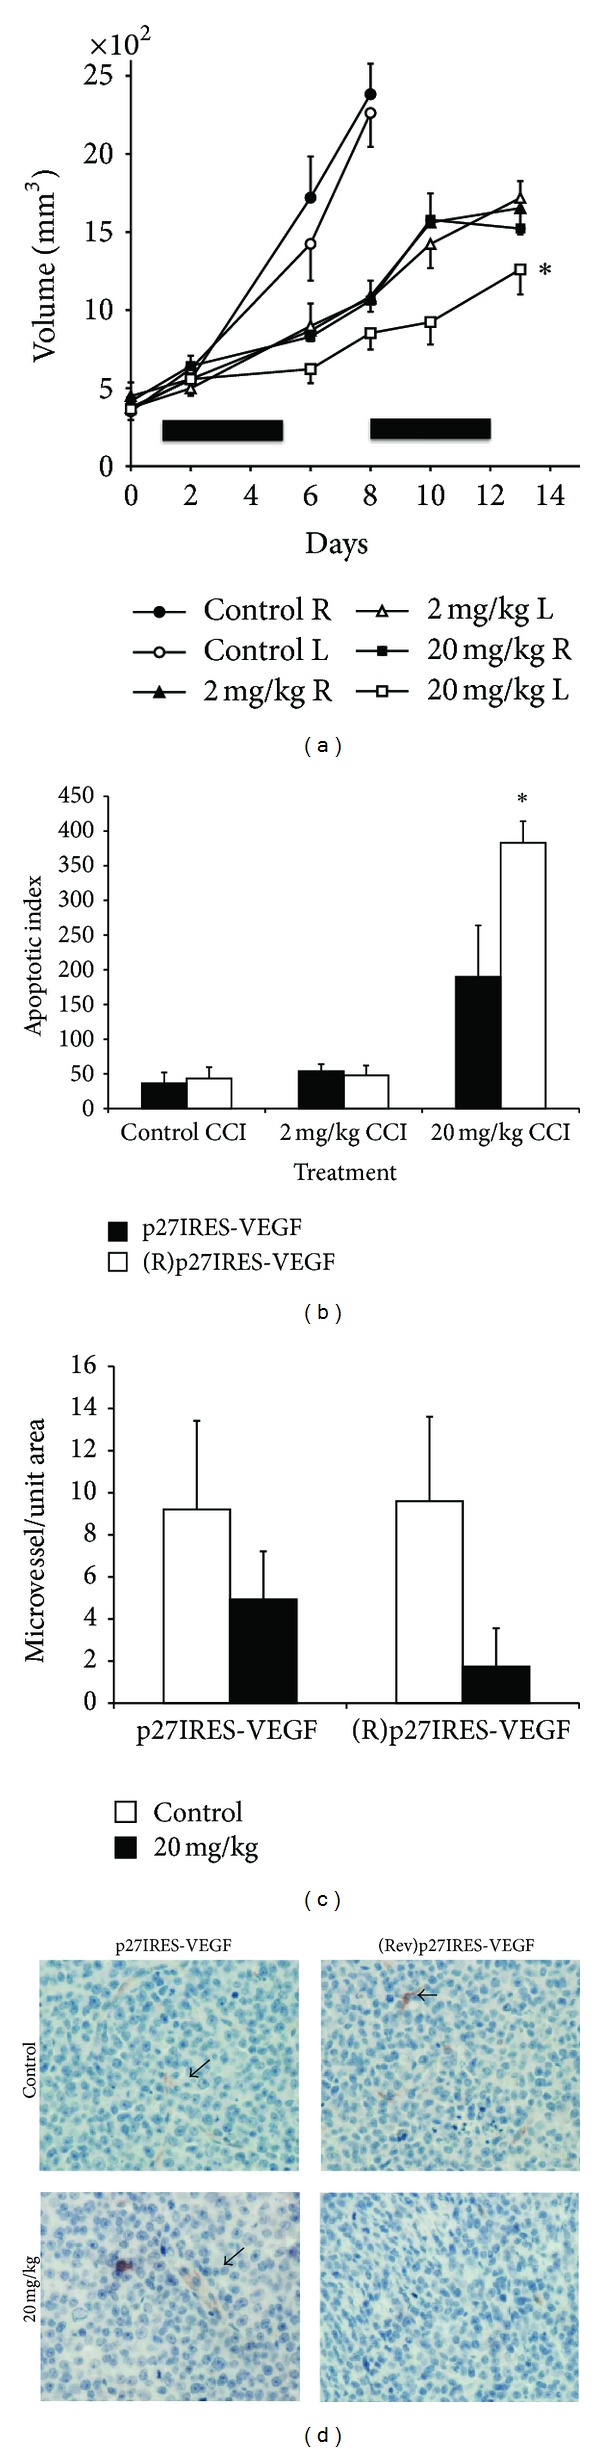
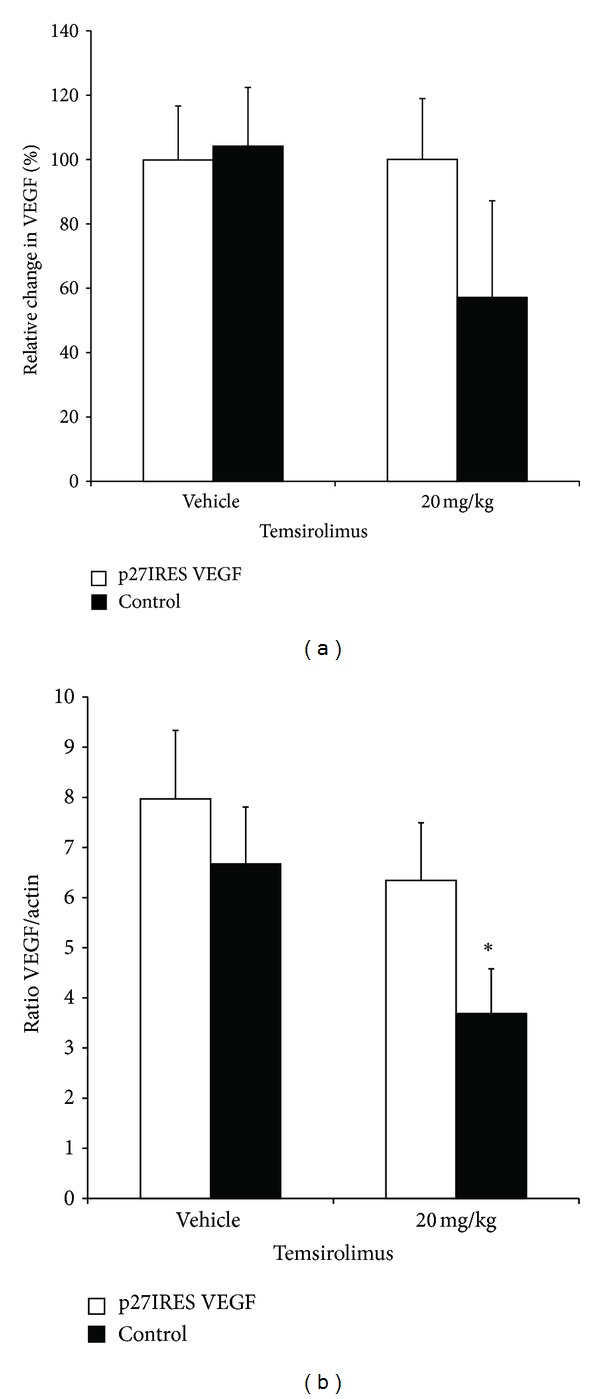
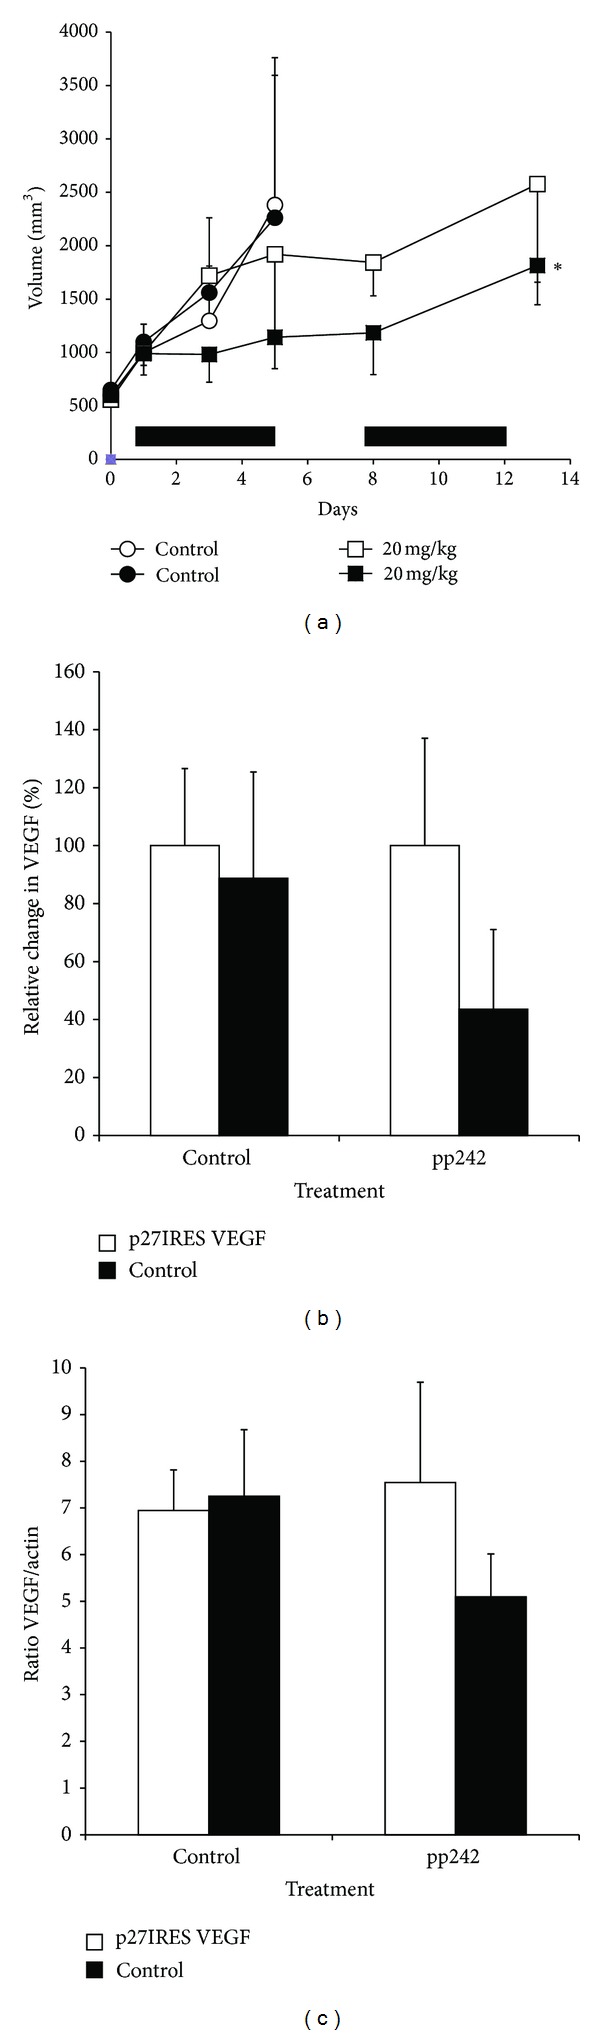
We found that rapalog mTOR inhibitors induce G1 arrest in the PTEN-null HS Sultan B-cell lymphoma line in vitro, but that administration of rapalogs in a HS Sultan xenograft model resulted in significant apoptosis, and that this correlated with induction of hypoxia and inhibition of neoangiogenesis and VEGF expression. Mechanistically, rapalogs prevent cap-dependent translation, but studies have shown that cap-independent, internal ribosome entry site (IRES)-mediated translation of genes, such as c-myc and cyclin D, can provide a fail-safe mechanism that regulates tumor survival. Therefore, we tested if IRES-dependent expression of VEGF could likewise regulate sensitivity of tumor cells in vivo. To achieve this, we developed isogenic HS Sultan cell lines that ectopically express the VEGF ORF fused to the p27 IRES, an IRES sequence that is insensitive to AKT-mediated inhibition of IRES activity and effective in PTEN-null tumors. Mice challenged with p27-VEGF transfected tumor cells were more resistant to the antiangiogenic and apoptotic effects of the rapalog, temsirolimus, and active site mTOR inhibitor, pp242. Our results confirm the critical role of VEGF expression in tumors during treatment with mTOR inhibitors and underscore the importance of IRES activity as a resistance mechanism to such targeted therapy.


Figures

Figure 1
Figure 1
Antitumor effects on HS Sultan cells in vivo and in vitro. (a) Cell cycle and apoptosis analysis of HS Sultan cells. G1/S arrest induced by 48-hour incubation with rapamycin was measured by propidium iodide to determine the percentage of cells in each phase (G1, S, or sub-G1), and anticleaved caspase-3 antibody was used to determine the percentage of cells undergoing apoptosis. Results shown are mean ± SEM of 4 independent experiments. (b) NOD/SCID mice (6 mice/group) were challenged subcutaneously with HS Sultan cells. When tumor size reached approximately 500 mm3, mice were randomly assigned to receive vehicle alone or varying doses of temsirolimus IP for 10 days, as described in “Materials and Methods.” Results are presented as tumor volume (mean ± SEM). Solid bars on x-axis denote days of IP treatment. Asterisks denote significant difference (P < 0.05) between control and temsirolimus-treated mice. (c) Cleaved caspase-3 staining of HS Sultan xenografts harvested from mice at day 13 was used to identify apoptosis. Results are presented as number of cleaved caspase-3 stained cells/microscopic field (original magnification 20X), mean ± SD, n = 10 fields for each tumor, and 4 tumors/group. Asterisk denotes significant difference (P < 0.05) between control and temsirolimus-treated mice. (d) VEGF-specific ELISA assay for expression of VEGF collected from HS Sultan xenografts lysate harvested from mice treated with vehicle control or temsirolimus (tumors collected on day 13). Lysate was pooled (N = 4 tumor/group) and are presented as the mean ± STD. Asterisk denotes significant difference (P < 0.05) between control and temsirolimus-treated mice. (e) Left panel. Representative slides of CD34-stained HS Sultan xenograft sections from mice treated with vehicle control (top panel) or 20 mg/kg temsirolimus (bottom panel) harvested on day 13. Original magnification, ×40. Arrow shows microvessel. Right panel. Results represent number of microvessel/area of microscopic field (original magnification, ×20) stained positive for CD34 and assessed as described in “Materials and Methods.” Data are mean ± SD, n = 10 fields/tumor, and 4 tumors/group. Asterisk denotes significant difference (P < 0.05) between control and temsirolimus-treated mice.
Figure 2
Figure 2
mTOR inhibition induces apoptosis and hypoxia in HS Sultan xenografts. (a) Analysis of pimonidazole staining (a marker of hypoxia) of HS Sultan xenografts harvested from mice at day 13. The area of pimonidazole staining/microscopic field (original magnification 20X) was measured by morphometric analysis as described in the “Materials and Methods.” Data are presented as mean ± SD, n = 10 fields for each tumor, and 4 tumors/group. Asterisk denotes significant difference (P < 0.05) between control and temsirolimus-treated mice. (b) Representative photomicrographs of immunohistochemistry of serial tumor sections of control or temsirolimus-treated tumors stained for hypoxia or cleaved caspase-3. *indicates same geographical location of tumor section pairs. Arrows indicate regions of apoptosis (in panels (ii) and (iv)) that colocalize to regions of hypoxia in corresponding serial section. Panels (i) (hypoxia) and (iii) (cleaved caspase-3) show serial sections from HS Sultan xenograft harvested on day 13 from vehicle control treated mouse. Panel (ii) (hypoxia) and panel (iv) (cleaved caspase-3) show serial sections from HS Sultan xenograft harvested on day 13 from 20 mg/kg temsirolimus-treated mouse. Additional serial tumor sections are shown in panel (v) (stained for hypoxia), panel (vi) (stained for apoptosis), panel (vii) (stained for hypoxia), and panel (viii) (stained for apoptosis) from HS Sultan xenografts harvested on day 13 from 20 mg/kg temsirolimus-treated mice. Arrows and (∗) in paired sections (panels (v) and (vi), panels (vii) and (viii)) indicate corresponding geographical regions. (c) Cleaved caspase-3 staining of HS Sultan xenografts harvested from mice at day 13 was used to identify apoptosis in normoxic and hypoxic regions. Hypoxic and normoxic regions were identified in pimonidazole-stained sections, and then the apoptotic index was determined in corresponding serial sections of cleaved caspase-3 stained slides. Results are number of cleaved caspase-3 stained cells/microscopic field (original magnification 20X) in either normoxic or hypoxic regions, mean ± SD, n = 10 fields for each tumor, and 4 tumors/group. Asterisk denotes significant difference (P < 0.05) between control and temsirolimus-treated mice.
Figure 3
Figure 3
Characterization of exogenous VEGF. (a) Cartoon of plasmids used to generate exogenous VEGF. The p27 IRES was cloned upstream of the VEGF ORF. (b) Stably transfected isogenic HS Sultan cell lines or HS Sultan parental cell line were treated with indicated concentration of rapamycin for 48 hours. ELISA was used to determine the VEGF levels/mg of protein in cell supernatants in triplicate (data are presented as mean ± SD). (c) The levels of FLAG-tagged VEGF were measured in cellular supernatants (in triplicate) using anti-FLAG ELISA and anti-VEGF secondary antibody (data are presented as mean ± SD).
Figure 4
Figure 4
Ectopic VEGF expression rescues tumor cells from the antitumor effects of temsirolimus in vivo. (a) NOD/SCID mice (6 mice/group) were challenged subcutaneously with 1 × 10⁶ HS Sultan cells stably transfected with exogenous VEGF expressing p27IRES-VEGF transfected cells (filled symbols) on the right flank and 1 × 10⁶control (Rev)p27IRES-VEGF transfected cells (open symbols) on the left flank. When tumor size reached approximately 500 mm3, mice were randomly assigned to receive vehicle alone, 2 mg/kg or 20 mg/kg temsirolimus IP for 10 days, as described in “Materials and Methods.” Results are presented as tumor volume (mean ± SEM). Solid bars on x-axis denote days of IP treatment. Asterisk denotes significant difference (P < 0.05) between the growth curves for p27IRES-VEGF transfected cells (filled squares) and (Rev)p27IRES-VEGF transfected cells (open squares) in the group of mice treated with 20 mg/kg temsirolimus. (b) Cleaved caspase-3 staining of isogenic HS Sultan xenografts harvested from mice at day 13 was used to identify apoptosis. Results are presented as number of cleaved caspase-3 stained cells/microscopic field (original magnification 20X), mean ± SD, n = 10 fields for each tumor, and 4 tumors/group. Asterisk denotes significant difference (P < 0.05) between control and temsirolimus-treated mice. (c) Effect of temsirolimus treatment on the MVD (#microvessel/area of microscopic field (original magnification, X20)) stained positive for CD34 and assessed as described in “Materials and Methods.” Data are mean ± SD, n = 10 fields/tumor, and 4 tumors/group. Asterisk denotes significant difference (P < 0.05) between control and temsirolimus (20 mg/kg) treated mice. (d) Representative slides of CD34-stained isogenic HS Sultan xenograft sections from mice treated with vehicle control (top panels) or 20 mg/kg temsirolimus (bottom panels) harvested on day 13. Original magnification, ×40. Arrow shows microvessel.
Figure 5
Figure 5
Rescue of VEGF expression in temsirolimus-treated tumors. (a) Relative change in VEGF expression. Isogenic HS Sultan tumors were grown on either flank of NOD/SCID mice (6 mice/group) that were treated with temsirolimus or vehicle control as described in Materials and Methods section. Tumors were harvested, and VEGF levels were measured in the tumor lysates by ELISA. Values are presented as the relative % change of VEGF expression between p27IRES-VEGF (open bars) and (Rev)p27IRES-VEGF (closed bars) tumors isolated from temsirolimus (20 mg/kg) or vehicle control-treated mice. Asterisk denotes significant difference (P < 0.05) in relative VEGF expression in (Rev)p27IRES-VEGF transfected cells between control and temsirolimus-treated mice. (b) VEGF expression was also measured in the tumor lysates by immunoblot. VEGF and actin levels were quantified by densitometry analysis and are shown as the ratios of VEGF/actin in p27IRES-VEGF transfected (open bars) and (Rev)p27IRES-VEGF transfected tumors in control or temsirolimus (20 mg/kg) treated mice. Values are the means ± SEM. Asterisk denotes significant difference (P < 0.05) in VEGF between the isogenic cell lines in temsirolimus-treated mice.
Figure 6
Figure 6
Antitumor effects of the active-site mTOR inhibitor, pp242, are ameliorated by exogenous VEGF expression. (a) NOD/SCID mice (4 mice/group) were challenged subcutaneously with 1 × 10⁶ HS Sultan cells stably transfected with exogenous VEGF expressing p27IRES-VEGF transfected cells (open symbols) on the right flank and 1 × 10⁶control (Rev)p27IRES-VEGF transfected cells (filled symbols) on the left flank. When tumor size reached approximately 500 mm3, mice were randomly assigned to receive vehicle alone or 20 mg/kg temsirolimus IP for 10 days, as described in “Materials and Methods.” Mice in the control group were euthanized by day 7 because the tumors had reached end-point criteria. Results are presented as tumor volume (mean ± SEM). Solid bars on x-axis denote days of IP treatment. Asterisk denotes significant difference (P < 0.05) between the growth curves for p27IRES-VEGF transfected cells (filled squares) and (Rev)p27IRES-VEGF transfected cells (open squares) in the group of mice treated with 20 mg/kg pp242. (b) Relative change in VEGF expression. Isogenic HS Sultan tumors were grown on either flank of NOD/SCID mice (4 mice/group) that were treated with temsirolimus or vehicle control as described in Materials and Methods section. Tumors were harvested, and VEGF levels were measured in the tumor lysates by ELISA. Values are presented as the relative % change of VEGF expression between p27IRES-VEGF (open bars) and (Rev)p27IRES-VEGF (closed bars) tumors isolated from temsirolimus (20 mg/kg) or vehicle control-treated mice. (c) VEGF expression was also measured in the tumor lysates by immunoblot. VEGF and actin levels were quantified by densitometry analysis and are shown as the ratios of VEGF/actin in p27IRES-VEGF transfected (open bars) and (Rev)p27IRES-VEGF transfected tumors in control or temsirolimus (20 mg/kg) treated mice. Values are the means ± SEM.

Similar articles

Cited by

References

    1. Atkins MB, Hidalgo M, Stadler WM, et al. Randomized phase II study of multiple dose levels of CCI-779, a novel mammalian target of rapamycin kinase inhibitor, in patients with advanced refractory renal cell carcinoma. Journal of Clinical Oncology. 2004;22(5):909–918. - PubMed
    1. Hudes G, Carducci M, Tomczak P, et al. Temsirolimus, interferon alfa, or both for advanced renal-cell carcinoma. The New England Journal of Medicine. 2007;356:2271–2281. - PubMed
    1. Younes A, Samad N. Utility of mTOR inhibition in hematologic malignancies. Oncologist. 2011;16(6):730–741. - PMC - PubMed
    1. Raje N, Kumar S, Hideshima T, et al. Combination of the mTOR inhibitor rapamycin and CC-5013 has synergistic activity in multiple myeloma. Blood. 2004;104(13):4188–4193. - PubMed
    1. Zangari M, Cavallo F, Tricot G. Farnesyltransferase inhibitors and rapamycin in the treatment of multiple myeloma. Current Pharmaceutical Biotechnology. 2006;7(6):449–453. - PubMed

LinkOut - more resources