

Improvement of liquid fructose-induced adipose tissue insulin resistance by ginger treatment in rats is associated with suppression of adipose macrophage-related proinflammatory cytokines
- PMID: 23533500
- PMCID: PMC3594984
- DOI: 10.1155/2013/590376
Improvement of liquid fructose-induced adipose tissue insulin resistance by ginger treatment in rats is associated with suppression of adipose macrophage-related proinflammatory cytokines
Abstract
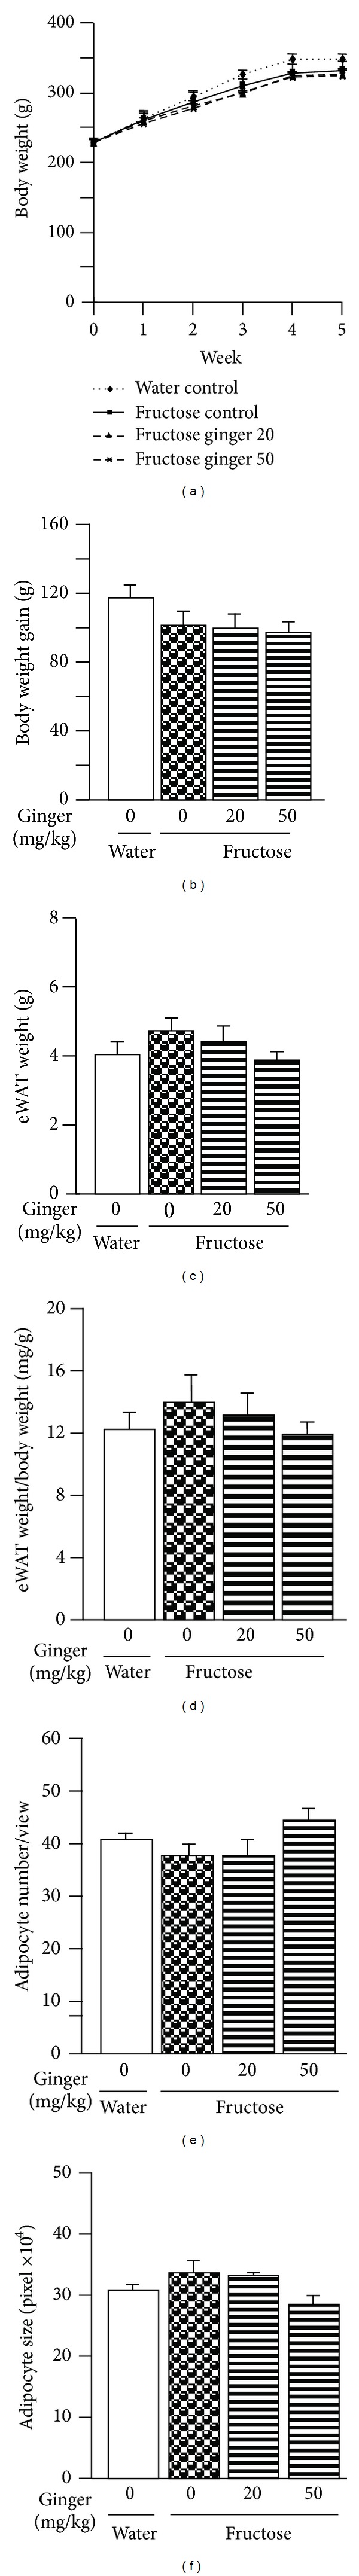
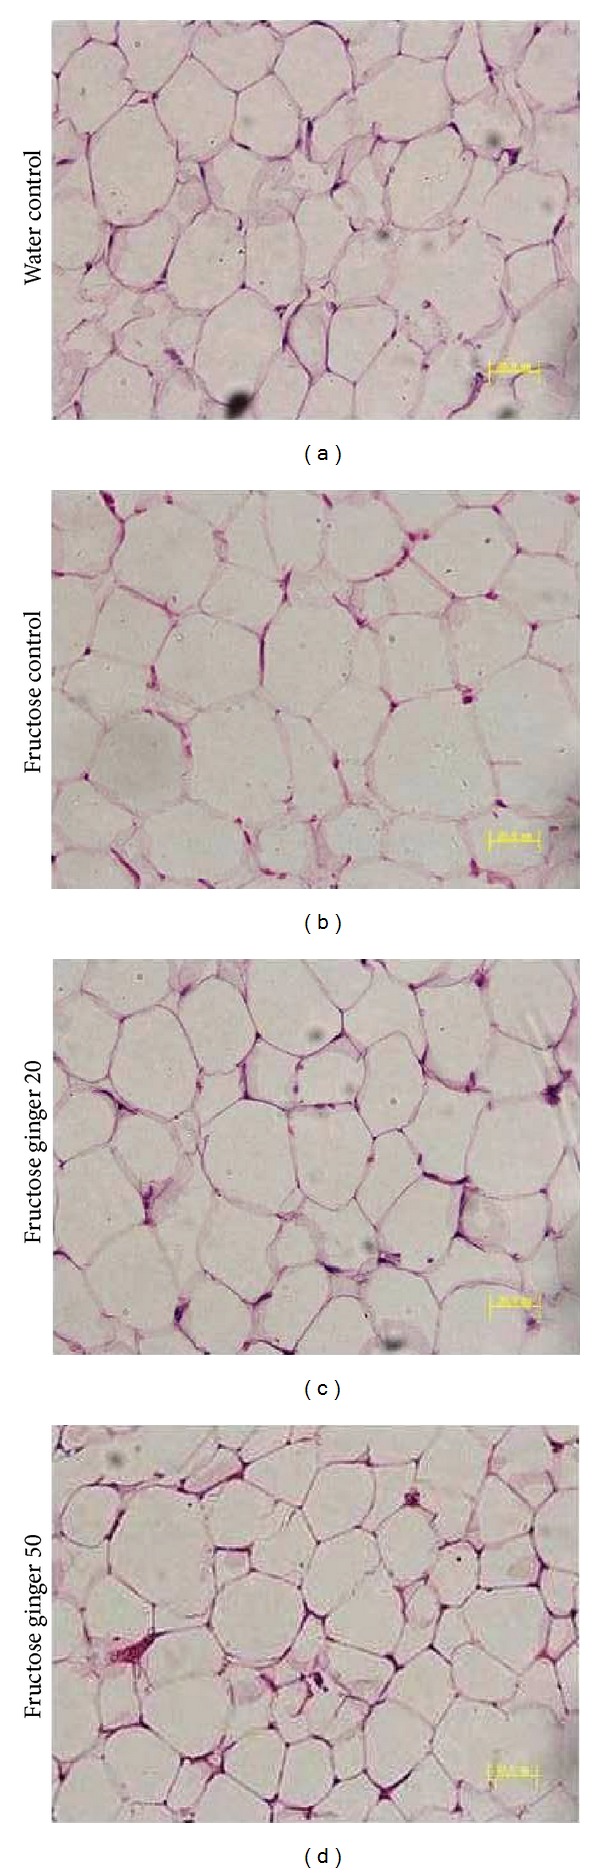
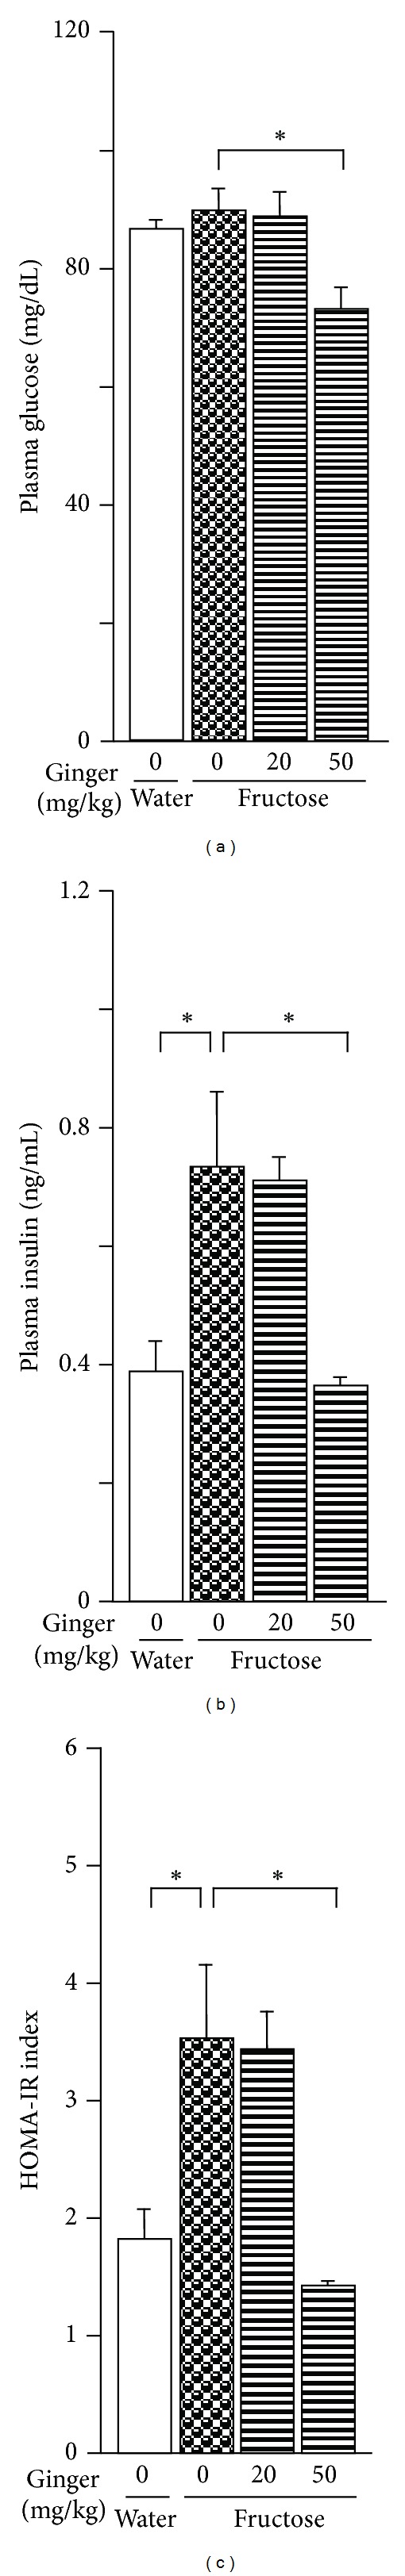
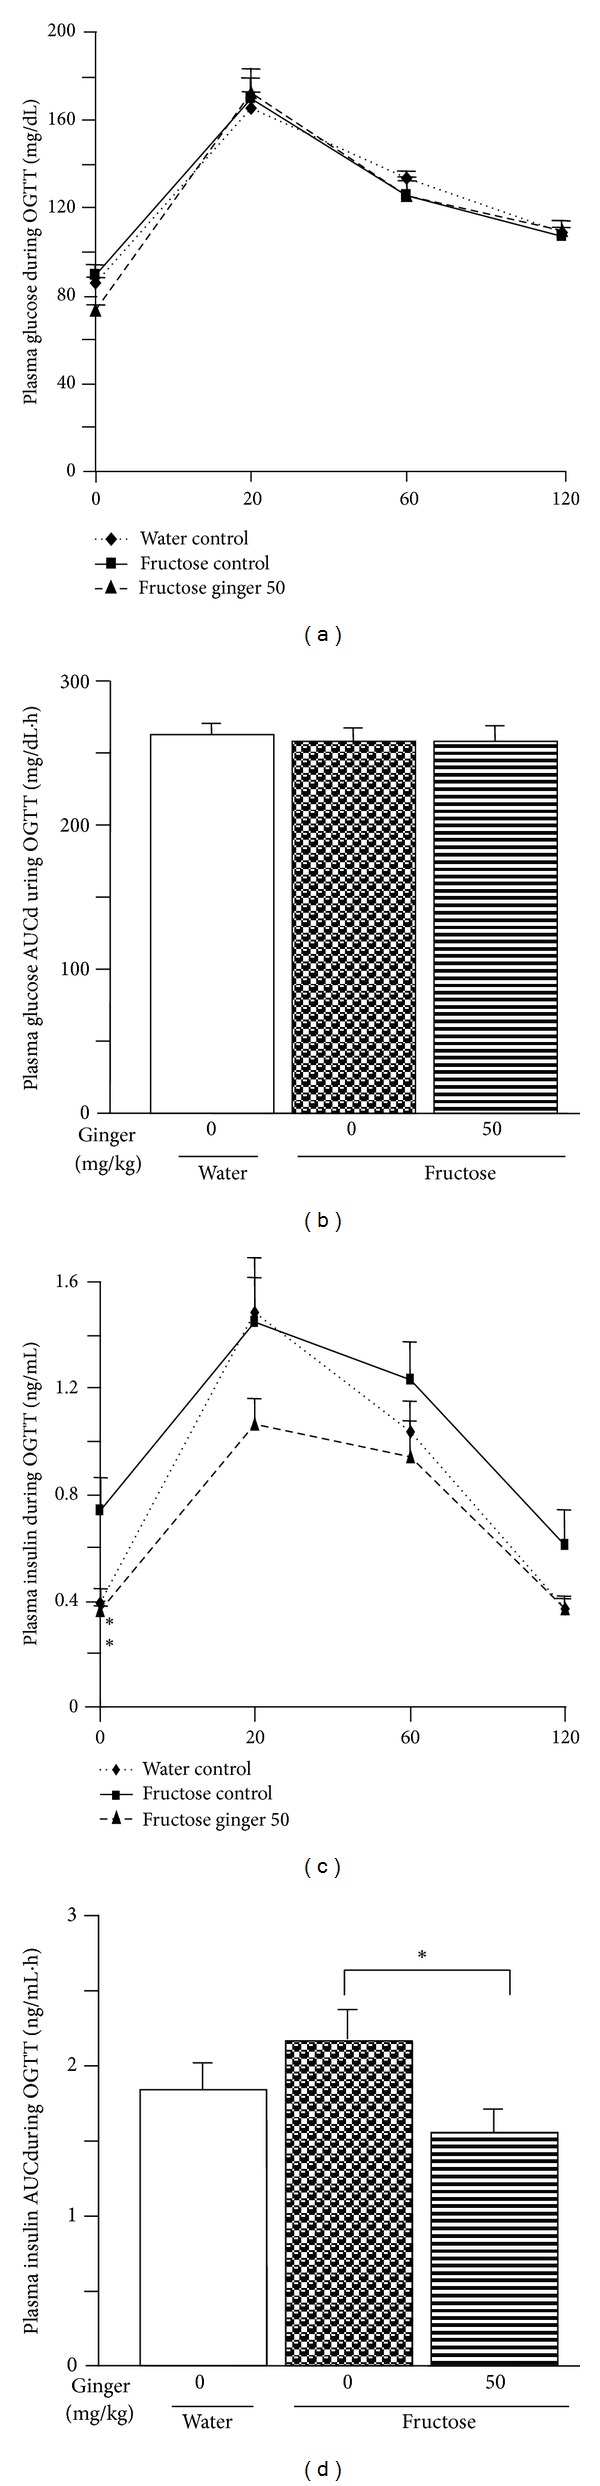
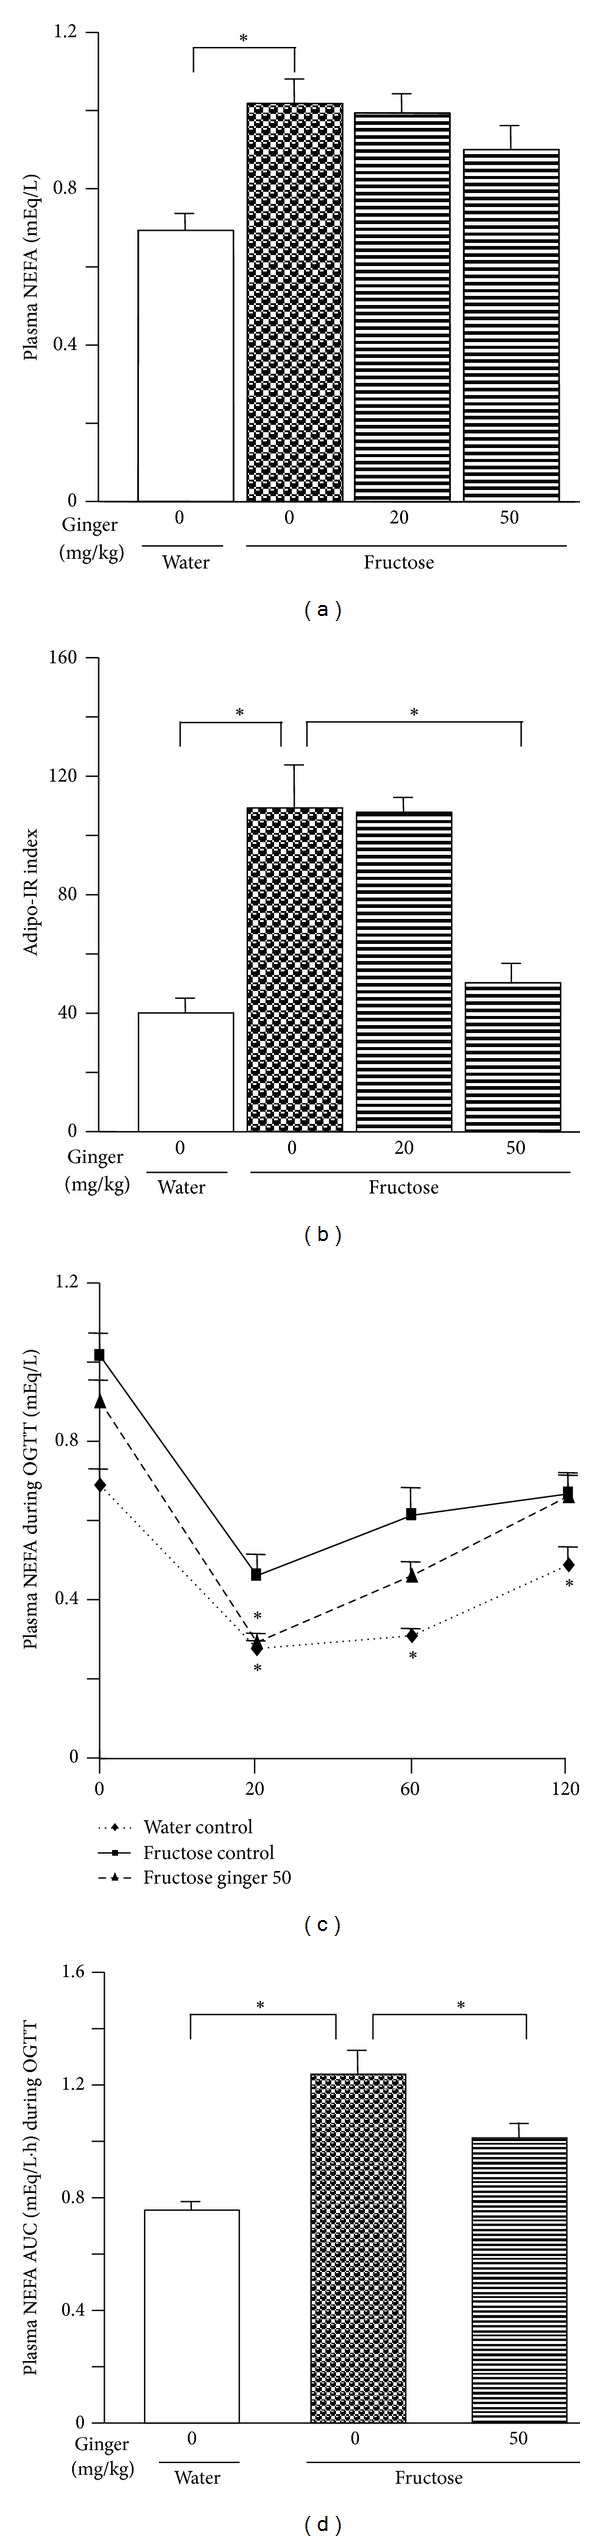
Adipose tissue insulin resistance (Adipo-IR) results in excessive release of free fatty acids from adipose tissue, which plays a key role in the development of "lipotoxicity." Therefore, amelioration of Adipo-IR may benefit the treatment of other metabolic abnormalities. Here we found that treatment with the alcoholic extract of ginger (50 mg/kg/day, by oral gavage) for five weeks attenuated liquid fructose-induced hyperinsulinemia and an increase in the homeostasis model assessment of insulin resistance (HOMA-IR) index in rats. More importantly, ginger reversed the increases in the Adipo-IR index and plasma nonesterified fatty acid concentrations during the oral glucose tolerance test assessment. Adipose gene/protein expression profiles revealed that ginger treatment suppressed CD68 and F4/80, two important macrophage accumulation markers. Consistently, the macrophage-associated cytokines tissue necrosis factor alpha and interleukin-6 were also downregulated. In contrast, insulin receptor substrate (IRS)-1, but not IRS-2, was upregulated. Moreover, monocyte chemotactic protein (MCP)-1 and its receptor chemokine (C-C motif) receptor-2 were also suppressed. Thus these results suggest that amelioration of fructose-induced Adipo-IR by ginger treatment in rats is associated with suppression of adipose macrophage-related proinflammatory cytokines.
Figures


Similar articles
-
Oleanolic acid supplement attenuates liquid fructose-induced adipose tissue insulin resistance through the insulin receptor substrate-1/phosphatidylinositol 3-kinase/Akt signaling pathway in rats.Toxicol Appl Pharmacol. 2014 Jun 1;277(2):155-63. doi: 10.1016/j.taap.2014.03.016. Epub 2014 Apr 2. Toxicol Appl Pharmacol. 2014. PMID: 24704288
-
Ginger extract diminishes chronic fructose consumption-induced kidney injury through suppression of renal overexpression of proinflammatory cytokines in rats.BMC Complement Altern Med. 2014 May 27;14:174. doi: 10.1186/1472-6882-14-174. BMC Complement Altern Med. 2014. PMID: 24885946 Free PMC article.
-
Angiotensin II receptor blocker ameliorates stress-induced adipose tissue inflammation and insulin resistance.PLoS One. 2014 Dec 31;9(12):e116163. doi: 10.1371/journal.pone.0116163. eCollection 2014. PLoS One. 2014. PMID: 25551221 Free PMC article.
-
Cellular and molecular players in adipose tissue inflammation in the development of obesity-induced insulin resistance.Biochim Biophys Acta. 2014 Mar;1842(3):446-62. doi: 10.1016/j.bbadis.2013.05.017. Epub 2013 May 22. Biochim Biophys Acta. 2014. PMID: 23707515 Free PMC article. Review.
-
Adipocyte-Macrophage Cross-Talk in Obesity.Adv Exp Med Biol. 2017;960:327-343. doi: 10.1007/978-3-319-48382-5_14. Adv Exp Med Biol. 2017. PMID: 28585206 Review.
Cited by
-
Effects of Ginger (Zingiber officinale) on the Hallmarks of Aging.Biomolecules. 2024 Aug 2;14(8):940. doi: 10.3390/biom14080940. Biomolecules. 2024. PMID: 39199328 Free PMC article. Review.
-
Ginger nanoparticles mediated induction of Foxa2 prevents high-fat diet-induced insulin resistance.Theranostics. 2022 Jan 1;12(3):1388-1403. doi: 10.7150/thno.62514. eCollection 2022. Theranostics. 2022. PMID: 35154496 Free PMC article.
-
Apple pomace and rosemary extract ameliorates hepatic steatosis in fructose-fed rats: Association with enhancing fatty acid oxidation and suppressing inflammation.Exp Ther Med. 2020 Sep;20(3):1975-1986. doi: 10.3892/etm.2020.8910. Epub 2020 Jun 19. Exp Ther Med. 2020. PMID: 32782507 Free PMC article.
-
Oleanolic Acid diminishes liquid fructose-induced Fatty liver in rats: role of modulation of hepatic sterol regulatory element-binding protein-1c-mediated expression of genes responsible for de novo Fatty Acid synthesis.Evid Based Complement Alternat Med. 2013;2013:534084. doi: 10.1155/2013/534084. Epub 2013 May 2. Evid Based Complement Alternat Med. 2013. PMID: 23737835 Free PMC article.
-
Ginger Water Reduces Body Weight Gain and Improves Energy Expenditure in Rats.Foods. 2020 Jan 2;9(1):38. doi: 10.3390/foods9010038. Foods. 2020. PMID: 31906567 Free PMC article.
References
-
- Boden G. Role of fatty acids in the pathogenesis of insulin resistance and NIDDM. Diabetes. 1997;46(1):3–10. - PubMed
-
- Gastaldelli A, Cusi K, Pettiti M, et al. Relationship between hepatic/visceral fat and hepatic insulin resistance in nondiabetic and type 2 diabetic subjects. Gastroenterology. 2007;133(2):496–506. - PubMed
-
- Gastaldelli A, Harrison SA, Belfort-Aguilar R, et al. Importance of changes in adipose tissue insulin resistance to histological response during thiazolidinedione treatment of patients with nonalcoholic steatohepatitis. Hepatology. 2009;50(4):1087–1093. - PubMed
LinkOut - more resources
Full Text Sources
Other Literature Sources
Miscellaneous
