Phylogenetic analysis reveals a cryptic species Blastomyces gilchristii, sp. nov. within the human pathogenic fungus Blastomyces dermatitidis
- PMID: 23533607
- PMCID: PMC3606480
- DOI: 10.1371/journal.pone.0059237
Phylogenetic analysis reveals a cryptic species Blastomyces gilchristii, sp. nov. within the human pathogenic fungus Blastomyces dermatitidis
Erratum in
-
Correction: Phylogenetic Analysis Reveals a Cryptic Species Blastomyces gilchristii, sp. nov. within the Human Pathogenic Fungus Blastomyces dermatitidis.PLoS One. 2016 Dec 9;11(12):e0168018. doi: 10.1371/journal.pone.0168018. eCollection 2016. PLoS One. 2016. PMID: 27936170 Free PMC article.
Abstract
Background: Analysis of the population genetic structure of microbial species is of fundamental importance to many scientific disciplines because it can identify cryptic species, reveal reproductive mode, and elucidate processes that contribute to pathogen evolution. Here, we examined the population genetic structure and geographic differentiation of the sexual, dimorphic fungus Blastomyces dermatitidis, the causative agent of blastomycosis.
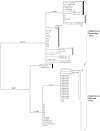
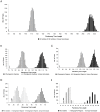
Methodology/principal findings: Criteria for Genealogical Concordance Phylogenetic Species Recognition (GCPSR) applied to seven nuclear loci (arf6, chs2, drk1, fads, pyrF, tub1, and its-2) from 78 clinical and environmental isolates identified two previously unrecognized phylogenetic species. Four of seven single gene phylogenies examined (chs2, drk1, pyrF, and its-2) supported the separation of Phylogenetic Species 1 (PS1) and Phylogenetic Species 2 (PS2) which were also well differentiated in the concatenated chs2-drk1-fads-pyrF-tub1-arf6-its2 genealogy with all isolates falling into one of two evolutionarily independent lineages. Phylogenetic species were genetically distinct with interspecific divergence 4-fold greater than intraspecific divergence and a high Fst value (0.772, P<0.001) indicative of restricted gene flow between PS1 and PS2. Whereas panmixia expected of a single freely recombining population was not observed, recombination was detected when PS1 and PS2 were assessed separately, suggesting reproductive isolation. Random mating among PS1 isolates, which were distributed across North America, was only detected after partitioning isolates into six geographic regions. The PS2 population, found predominantly in the hyper-endemic regions of northwestern Ontario, Wisconsin, and Minnesota, contained a substantial clonal component with random mating detected only among unique genotypes in the population.
Conclusions/significance: These analyses provide evidence for a genetically divergent clade within Blastomyces dermatitidis, which we use to describe a novel species, Blastomyces gilchristii sp. nov. In addition, we discuss the value of population genetic and phylogenetic analyses as a foundation for disease surveillance, understanding pathogen evolution, and discerning phenotypic differences between phylogenetic species.
Conflict of interest statement
Figures


References
-
- Kluyver AJ, van Niel CB (1956) The Microbe’s contribution to biology. Cambridge, MA: Harvard University Press.
-
- Heywood VH (1995) The global biodiversity assessment. United Nations Environment Programme. Cambridge, MA: Cambridge University Press.
-
- Hawksworth DL (2001) The magnitude of fungal diversity: The 1.5 million species estimate revisited. Mycol Res 105: 1422–1432.
-
- Dettman JR, Jacobson DJ, Taylor JW (2003) A multilocus genealogical approach to phylogenetic species recognition in the model eukaryote Neurospora . Evolution 57: 2703–2720. - PubMed
Publication types
MeSH terms
Substances
LinkOut - more resources
Full Text Sources
Other Literature Sources
Molecular Biology Databases
Miscellaneous

