. 2013;8(3):e60105.
doi: 10.1371/journal.pone.0060105. Epub 2013 Mar 22.

Molecular and clinical studies in 138 Japanese patients with Silver-Russell syndrome

Affiliations

Molecular and clinical studies in 138 Japanese patients with Silver-Russell syndrome

Tomoko Fuke et al. PLoS One. 2013.

Abstract

Background: Recent studies have revealed relative frequency and characteristic phenotype of two major causative factors for Silver-Russell syndrome (SRS), i.e. epimutation of the H19-differentially methylated region (DMR) and uniparental maternal disomy 7 (upd(7)mat), as well as multilocus methylation abnormalities and positive correlation between methylation index and body and placental sizes in H19-DMR epimutation. Furthermore, rare genomic alterations have been found in a few of patients with idiopathic SRS. Here, we performed molecular and clinical findings in 138 Japanese SRS patients, and examined these matters.

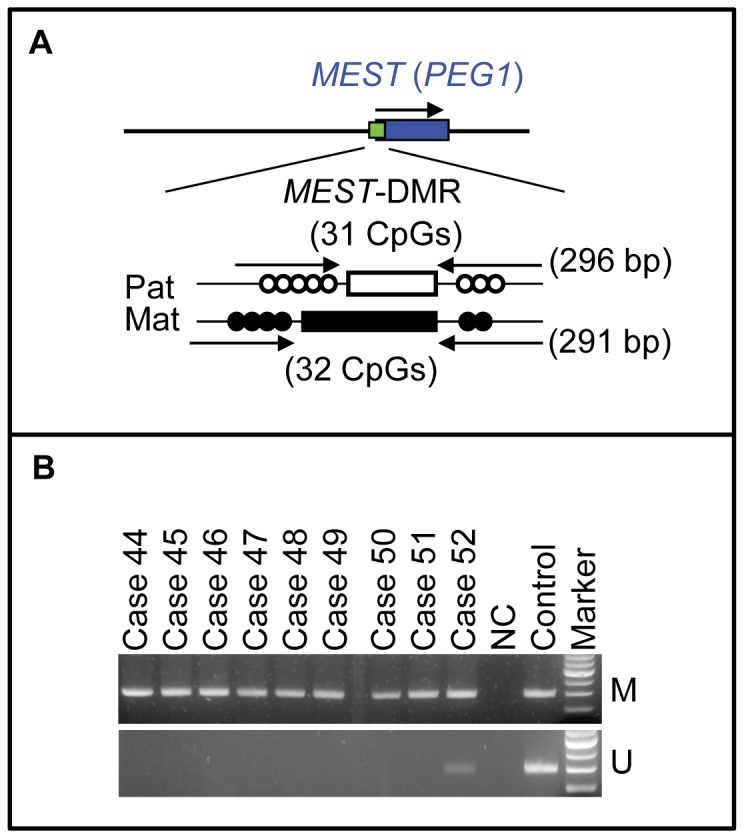
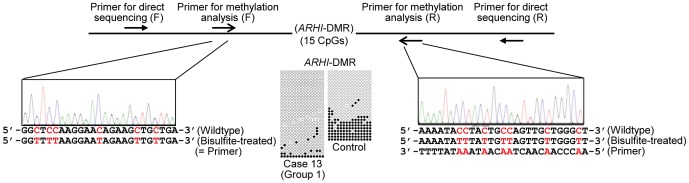
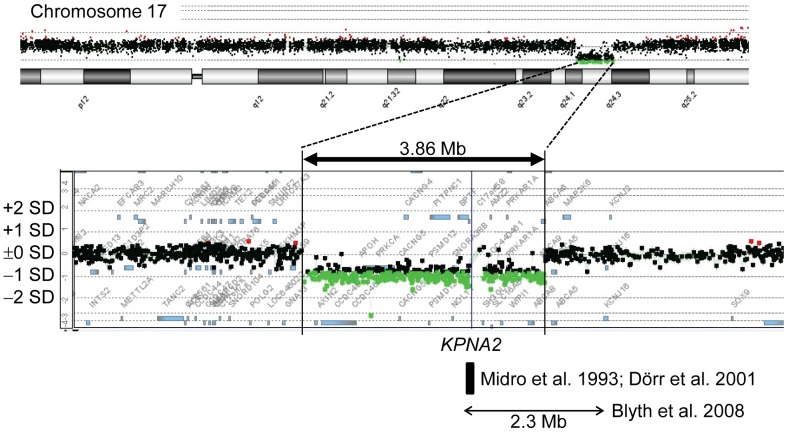
Methodology/principal findings: We identified H19-DMR epimutation in cases 1-43 (group 1), upd(7)mat in cases 44-52 (group 2), and neither H19-DMR epimutation nor upd(7)mat in cases 53-138 (group 3). Multilocus analysis revealed hyper- or hypomethylated DMRs in 2.4% of examined DMRs in group 1; in particular, an extremely hypomethylated ARHI-DMR was identified in case 13. Oligonucleotide array comparative genomic hybridization identified a ∼3.86 Mb deletion at chromosome 17q24 in case 73. Epigenotype-phenotype analysis revealed that group 1 had more reduced birth length and weight, more preserved birth occipitofrontal circumference (OFC), more frequent body asymmetry and brachydactyly, and less frequent speech delay than group 2. The degree of placental hypoplasia was similar between the two groups. In group 1, the methylation index for the H19-DMR was positively correlated with birth length and weight, present height and weight, and placental weight, but with neither birth nor present OFC.

Conclusions/significance: The results are grossly consistent with the previously reported data, although the frequency of epimutations is lower in the Japanese SRS patients than in the Western European SRS patients. Furthermore, the results provide useful information regarding placental hypoplasia in SRS, clinical phenotypes of the hypomethylated ARHI-DMR, and underlying causative factors for idiopathic SRS.


Conflict of interest statement

Competing Interests: The authors have declared that no competing interests exist.

Figures

Figure 1
Figure 1. Methylation analysis of the H19-DMR, using bisulfite-treated genomic DNA.
A. Schematic representation of a segment encompassing 21 CpG dinucleotides (CG1→CG21) within the H19-DMR. The cytosine residues at the CpG dinucleotides are usually methylated after paternal transmission (filled circles) and unmethylated after maternal transmission (open circles). The CTCF binding site 6 (CTCF6) is indicated with a blue rectangle; the cytosine residue at CG8 constitutes a C/T SNP (indicated with a gray rectangle). For pyrosequencing analysis, a 279 bp segment was PCR-amplified with PyF & PyR primers, and a sequence primer (SP) was hybridized to a single-stranded PCR products. Subsequently, the MIs were obtained for four CpG dinucleotides (CG5–CG7 and CG9) (indicated with a yellow rectangle). For COBRA, a 435 bp region was PCR-amplified with CoF & CoR primers, and the PCR product was digested with methylated allele-specific restriction enzymes to examine the methylation pattern of CG5 ands CG16 (the PCR products is digested with Hpy188I when the cytosine residue at CG5 is methylated and with AflIII when the cytosine residue at CG16 is methylated) (indicated with orange rectangles). IGF2 is a paternally expressed gene, and H19 is a maternally expressed gene. The stippled ellipse indicates the enhancer for IGF2 and H19. B. Pyrosequencing data. Left part: Representative results indicating the MIs for CG5– CG7 and CG9. CG5– CG7 and CG9 are hypomethylated in case 1, and similarly methylated between case 53 and a control subject. Right part: Histograms showing the distribution of the MIs (the horizontal axis: the methylation index; and the vertical axis: the patient number). Forty-three SRS patients with low MIs are shown in red. C. COBRA data. Left part: Representative findings of PCR products loaded onto a DNA 1000 LabChip (Agilent, Santa Clara, CA, USA) after digestion with Hpy188I or AflIII. U: unmethylated clone specific bands; M: methylated clone specific bands; and BWS: Beckwith-Wiedemann syndrome patient with upd(11p15)pat. Right part: Histograms showing the distribution of the MIs.
Figure 2
Figure 2. Methylated and unmethylated allele-specific PCR analysis for the MEST-DMR.
A. Schematic representation of the MEST-DMR. The cytosine residues at the CpG dinucleotides are usually unmethylated after paternal transmission (open circles) and methylated after maternal transmission (filled circles). The PCR primers have been designed to hybridize either methylated or unmethylated clones. B. The results of methylation analysis with methylated and unmethylated allele-specific primers.
Figure 3
Figure 3. Analysis of the ARHI-DMR in case 13.
For bisulfite sequencing, each line indicates a single clone, and each circle denotes a CpG dinucleotide; the cytosine residues at the CpG dinucleotides are usually unmethylated after paternal transmission (open circles) and methylated after maternal transmission (filled circles). Electrochromatograms delineate the sequences of the primer binding sites utilized for the methylation analysis.
Figure 4
Figure 4. Oligonucleotide array CGH in case 73, showing a ∼3.86 Mb deletion at chromosome 17q24.
The black, the red, and the green dots denote signals indicative of the normal, the increased(>+0.5), and the decreased (< –1.0) copy numbers, respectively. The horizontal bar with arrowheads indicates a ∼2.3 Mb deletion identified in a patient with Carney complex and SRS-like phenotype , and the black square represent a ∼65 kb segment harboring the breakpoint of a de novo translocation 46,XY,t(1;17)(q24;q23–q24) identified in a patient with SRS phenotype , .

References

    1. Eggermann T (2010) Russell-Silver syndrome. Am J Med Genet C Semin Med Genet 154C: 355–364. - PubMed
    1. Binder G, Begemann M, Eggermann T, Kannenberg K (2011) Silver-Russell syndrome. Best Pract Res Clin Endocrinol Metab 25: 153–160. - PubMed
    1. Wakeling EL, Amero SA, Alders M, Bliek J, Forsythe E, et al. (2010) Epigenotype-phenotype correlations in Silver-Russell syndrome. J Med Genet 47: 760–768. - PMC - PubMed
    1. Yamazawa K, Kagami M, Nagai T, Kondoh T, Onigata K, et al. (2008) Molecular and clinical findings and their correlations in Silver-Russell syndrome: implications for a positive role of IGF2 in growth determination and differential imprinting regulation of the IGF2-H19 domain in bodies and placentas. J Mol Med (Berl) 86: 1171–1181. - PubMed
    1. Fowden AL, Sibley C, Reik W, Constancia M (2006) Imprinted genes, placental development and fetal growth. Horm Res 65 Suppl 3: 50–58. - PubMed

Publication types

LinkOut - more resources