. 2013 Jun;131(6):1611-23.
doi: 10.1016/j.jaci.2012.11.054. Epub 2013 Mar 25.

Dominant gain-of-function STAT1 mutations in FOXP3 wild-type immune dysregulation-polyendocrinopathy-enteropathy-X-linked-like syndrome

Affiliations

Dominant gain-of-function STAT1 mutations in FOXP3 wild-type immune dysregulation-polyendocrinopathy-enteropathy-X-linked-like syndrome

Gulbu Uzel et al. J Allergy Clin Immunol. 2013 Jun.

Abstract

Background: Mutations in signal transducer and activator of transcription (STAT) 1 cause a broad spectrum of disease, ranging from severe viral and bacterial infections (amorphic alleles) to mild disseminated mycobacterial disease (hypomorphic alleles) to chronic mucocutaneous candidiasis (CMC; hypermorphic alleles). The hypermorphic mutations are also associated with arterial aneurysms, autoimmunity, and squamous cell cancers.

Objective: We sought to investigate the role of STAT1 gain-of-function mutations in phenotypes other than CMC.

Methods: We initially screened patients with CMC and autoimmunity for STAT1 mutations. We functionally characterized mutations in vitro and studied immune profiles and regulatory T (Treg) cells. After our initial case identifications, we explored 2 large cohorts of patients with wild-type forkhead box protein 3 and an immune dysregulation-polyendocrinopathy-enteropathy-X-linked (IPEX)-like phenotype for STAT1 mutations.

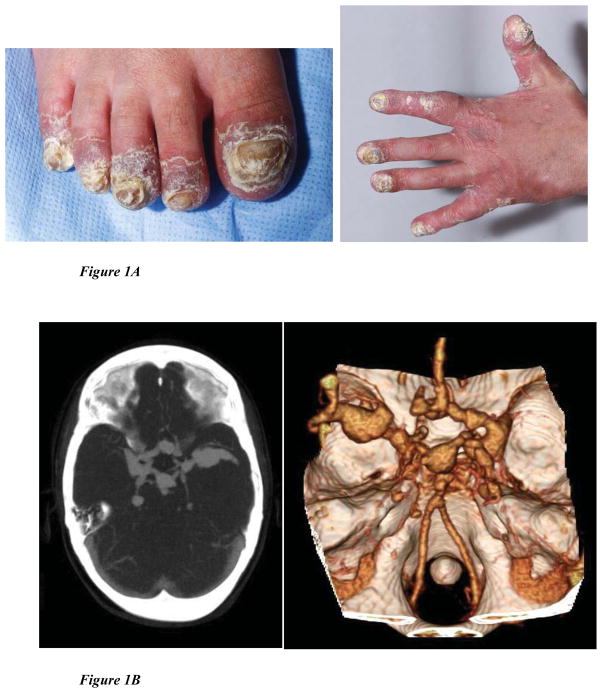
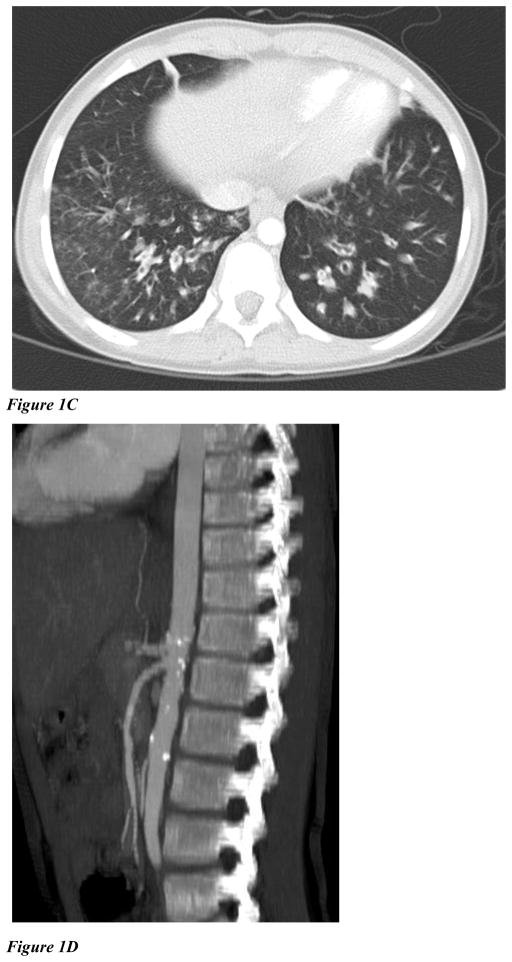
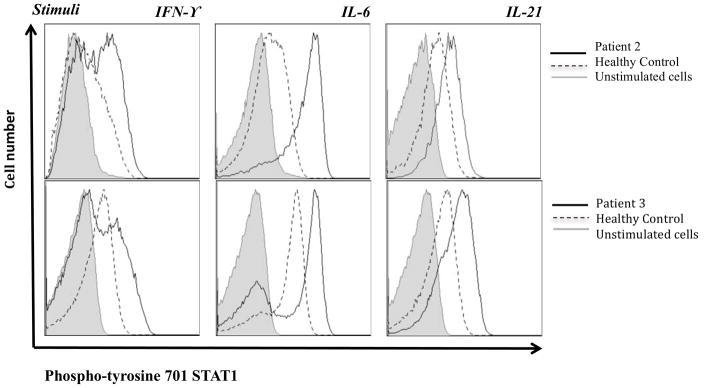
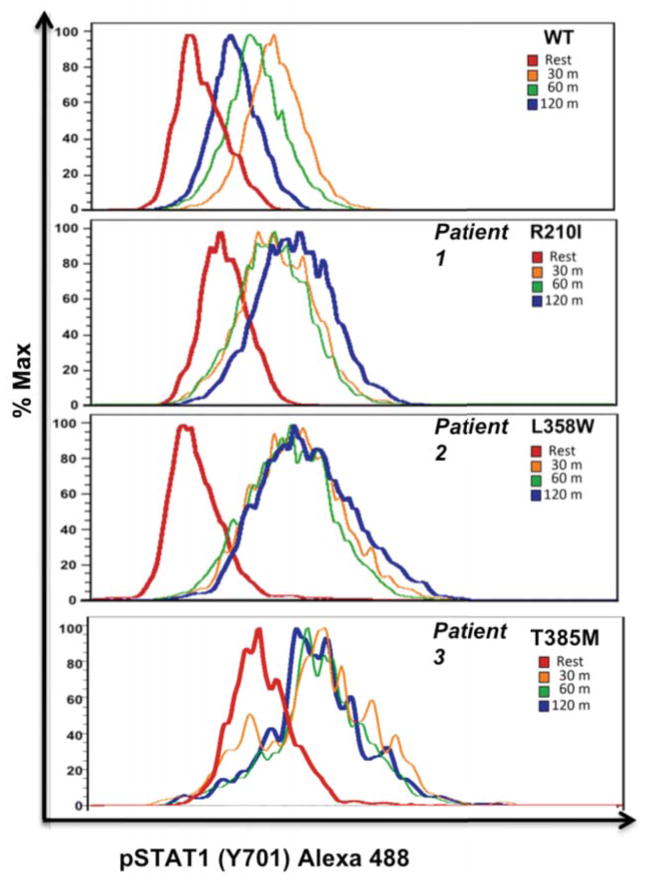
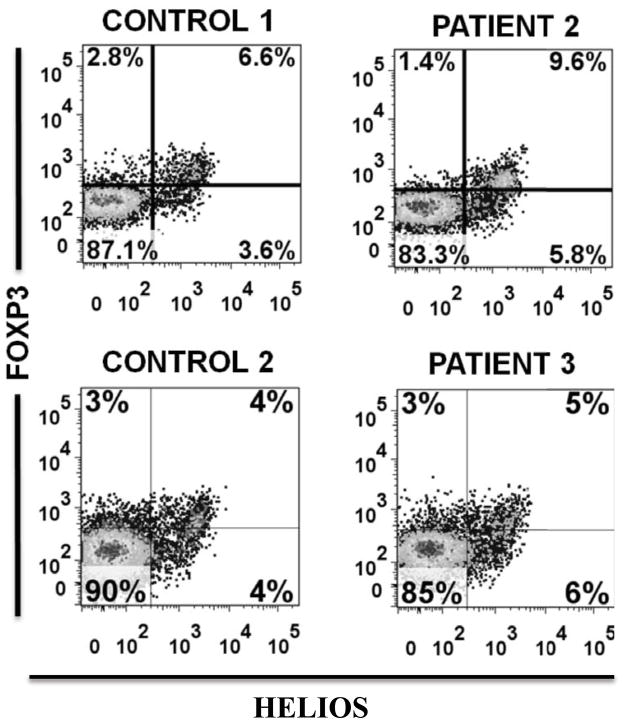
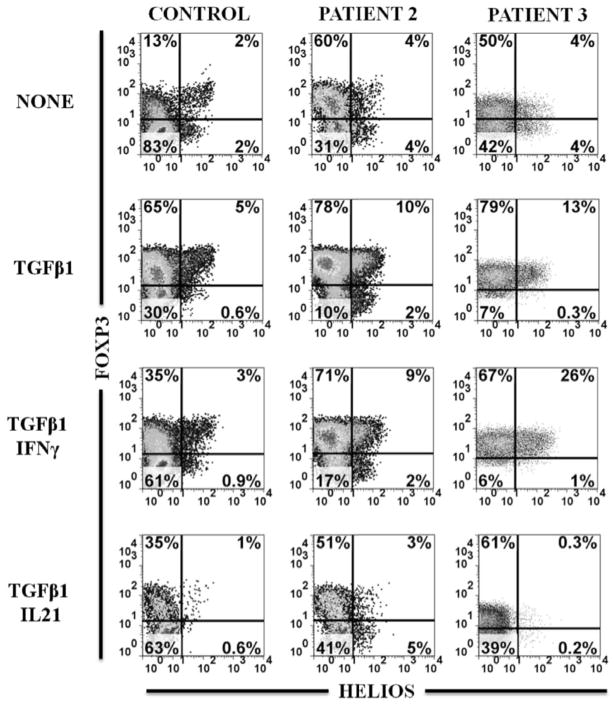
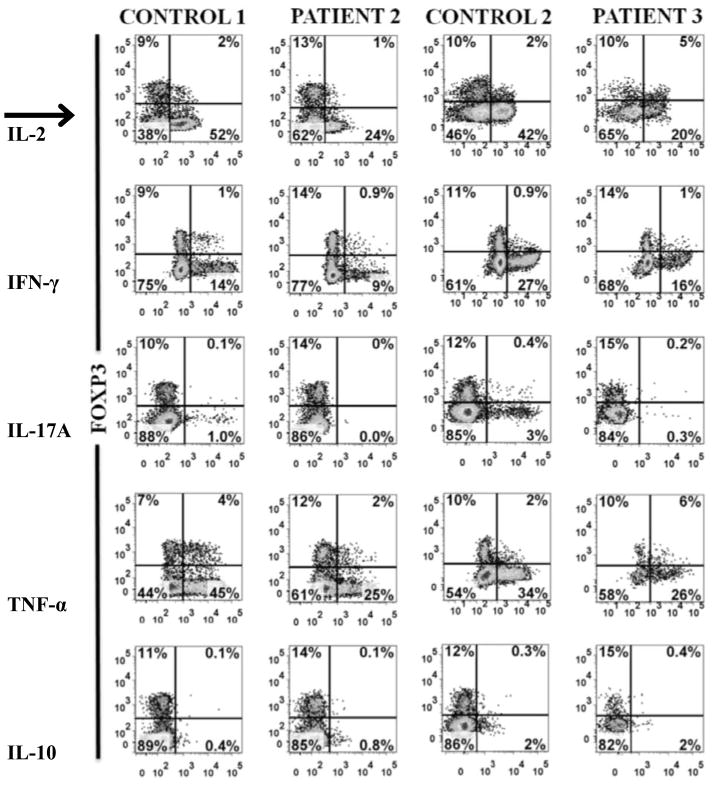
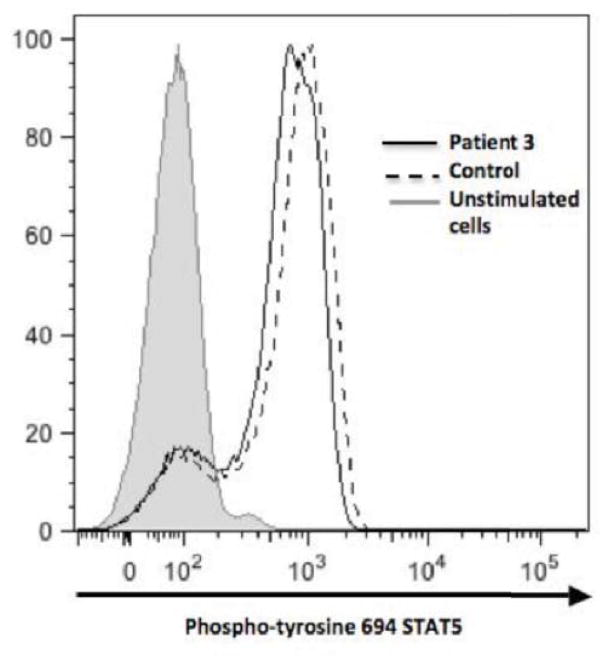
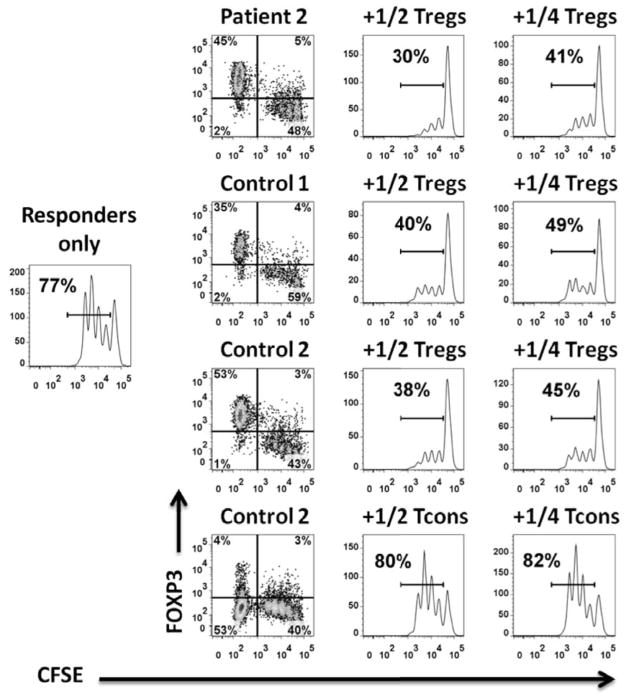
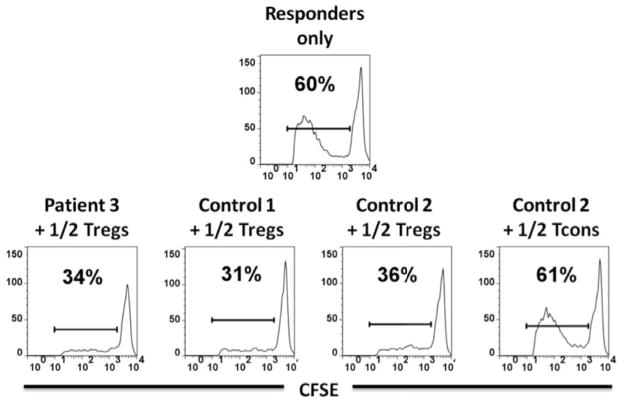
Results: We identified 5 children with polyendocrinopathy, enteropathy, and dermatitis reminiscent of IPEX syndrome; all but 1 had a variety of mucosal and disseminated fungal infections. All patients lacked forkhead box protein 3 mutations but had uniallelic STAT1 mutations (c.629 G>T, p.R210I; c.1073 T>G, p.L358W, c.796G>A; p.V266I; c.1154C>T, T385M [2 patients]). STAT1 phosphorylation in response to IFN-γ, IL-6, and IL-21 was increased and prolonged. CD4(+) IL-17-producing T-cell numbers were diminished. All patients had normal Treg cell percentages in the CD4(+) T-cell compartment, and their function was intact in the 2 patients tested. Patients with cells available for study had normal levels of IL-2-induced STAT5 phosphorylation.

Conclusions: Gain-of-function mutations in STAT1 can cause an IPEX-like phenotype with normal frequency and function of Treg cells.


Figures

Figure 1
Figure 1. Clinical Phenotypes
(A): Patient 1, extensive candidiasis of nails, causing dystrophy and paronychia. (B): Patient 3, Multiple intracranial aneurysms in the Circle of Willis, as detected by CT angiogram and MR angiogram. (1C): Bilateral lower lobe bronchiectasis with endobronchial/peribronchial consolidation seen on chest CT. (1D): multiple calcifications in descending aorta detected by CT of patient 3.
Figure 2
Figure 2. STAT1 staining
(A): Intracellular staining of phospho-tyrosine 701 STAT1 in CD3+ lymphocytes isolated from healthy controls and STAT1 gain of function mutants (patient 2 and 3) after stimulation with IFN-γ, IL-6, or IL-21 for 15 minutes. (B): Kinetics of the STAT1 phosphorylation were studied by intracellular phospho-tyrosine 701 STAT1 staining in U3A cells transfected with mutant or WT constructs and stimulated with IFN-γ. Stimulation indices at 60 minutes following stimulation (SI: MFI of pSTAT1 at 60′ after stimulation /MFI pSTAT1 at rest) were higher for mutants (SI: 2.6 for R210I, 4.0 for L358W, and 4.4 for T385M), than for WT STAT1 (SI of 0.9, p <0.05).
Figure 3
Figure 3. Treg subsets, FOXP3 expression, cytokine profiles and STAT5 signaling
(A): Percentage and level of FOXP3 and HELIOS expression within CD3+CD4+ gated T cells from patients 2 and 3 compared to healthy controls. (B): Induction of FOXP3 and absence of HELIOS expression in naïve T cells from healthy control and patients 2 and 3 on day 5 after anti-CD3/CD28 stimulation in the presence of IL-2 (NONE) only, + TGF-β1, + TGF-β1 and IFN-γ or + TGF-β1 and IL-21. (C): Comparison of cytokine expression between FOXP3+ and FOXPCD4+ T cells within fresh PBMCs of healthy controls and patients 2 and 3 stimulated with PMA/ionomycin. (D): Normal IL-2 induced STAT5 phosphorylation in CD3+ lymphocytes of patient 3 (solid line histogram) compared to healthy control (dashed histogram) and unstimulated cells (shaded histogram). Patient 2 had similar expression profile (data not shown).
Figure 4
Figure 4. Tregs suppressive function
(A) : Responders only histogram represents CFSE dilution on day 4 within CD4+ T cells. The histograms in the two right columns demonstrate the level of proliferative suppression within CFSE+ cells in the presence of 1/2 and 1/4 the numbers of Tregs and Teffs relative to responders. Left FACS plot column shows the level of FOXP3 expression within CFS Tregs/Teffs and CFSE+ responders on day 4. Patient 2 and control 1 are allogeneic and control 2 is autologous to responders and HLA-DR+ APCs. (B) Suppressive function of Tregs from patient 3 and healthy controls. Patient 3 and control 1 are allogeneic and control 2 is autologous to responders and HLA-DR+ APCs.

References

    1. Boisson-Dupuis S, Kong XF, Okada S, Cypowyj S, Puel A, Abel L, et al. Inborn errors of human STAT1: allelic heterogeneity governs the diversity of immunological and infectious phenotypes. Curr Opin Immunol. 2012;24:364–78. - PMC - PubMed
    1. Liu L, Okada S, Kong XF, Kreins AY, Cypowyj S, Abhyankar A, et al. Gain-of-function human STAT1 mutations impair IL-17 immunity and underlie chronic mucocutaneous candidiasis. The Journal of experimental medicine. 2011;208:1635–48. - PMC - PubMed
    1. van de Veerdonk FL, Plantinga TS, Hoischen A, Smeekens SP, Joosten LA, Gilissen C, et al. STAT1 mutations in autosomal dominant chronic mucocutaneous candidiasis. The New England journal of medicine. 2011;365:54–61. - PubMed
    1. Sampaio Eea. Human Autosomal Dominant STAT1 Mutations Are Associated With Disseminated Coccidioidomycosis And Histoplasmosis. Journal of Allergy and Clinical Immunology. 2012 accompanying submission.
    1. Bennett CL, Christie J, Ramsdell F, Brunkow ME, Ferguson PJ, Whitesell L, et al. The immune dysregulation, polyendocrinopathy, enteropathy, X-linked syndrome (IPEX) is caused by mutations of FOXP3. Nature genetics. 2001;27:20–1. - PubMed

Publication types

MeSH terms