Genomic predictability of interconnected biparental maize populations
- PMID: 23535384
- PMCID: PMC3664858
- DOI: 10.1534/genetics.113.150227
Genomic predictability of interconnected biparental maize populations
Abstract
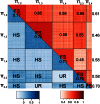
Intense structuring of plant breeding populations challenges the design of the training set (TS) in genomic selection (GS). An important open question is how the TS should be constructed from multiple related or unrelated small biparental families to predict progeny from individual crosses. Here, we used a set of five interconnected maize (Zea mays L.) populations of doubled-haploid (DH) lines derived from four parents to systematically investigate how the composition of the TS affects the prediction accuracy for lines from individual crosses. A total of 635 DH lines genotyped with 16,741 polymorphic SNPs were evaluated for five traits including Gibberella ear rot severity and three kernel yield component traits. The populations showed a genomic similarity pattern, which reflects the crossing scheme with a clear separation of full sibs, half sibs, and unrelated groups. Prediction accuracies within full-sib families of DH lines followed closely theoretical expectations, accounting for the influence of sample size and heritability of the trait. Prediction accuracies declined by 42% if full-sib DH lines were replaced by half-sib DH lines, but statistically significantly better results could be achieved if half-sib DH lines were available from both instead of only one parent of the validation population. Once both parents of the validation population were represented in the TS, including more crosses with a constant TS size did not increase accuracies. Unrelated crosses showing opposite linkage phases with the validation population resulted in negative or reduced prediction accuracies, if used alone or in combination with related families, respectively. We suggest identifying and excluding such crosses from the TS. Moreover, the observed variability among populations and traits suggests that these uncertainties must be taken into account in models optimizing the allocation of resources in GS.
Keywords: Fusarium graminearum; G-BLUP; GenPred; shared data resources; whole-genome prediction.
Figures


References
-
- Albrecht T., Wimmer V., Auinger H.-J., Erbe M., Knaak C., et al. , 2011. Genome-based prediction of testcross values in maize. Theor. Appl. Genet. 123: 339–350. - PubMed
-
- Asoro F. G., Newell M. A., Beavis W. D., Scott M. P., Jannink J.-L., 2011. Accuracy and training population design for genomic selection on quantitative traits in elite North American oats. Plant Genome 4: 132–144.
-
- Astle W., Balding D. J., 2009. Population structure and cryptic relatedness in genetic association studies. Stat. Sci. 24: 451–471.
-
- Bernardo R., Yu J., 2009. Prospects for genomewide selection for quantitative traits in maize. Crop Sci. 47: 1082–1090.
-
- Bolduan C., Montes J.-M., Dhillon B. S., Mirdita V., Melchinger A. E., 2009. Determination of mycotoxin concentration by ELISA and near-infrared spectroscopy in fusarium-inoculated maize. Cereal Res. Commun. 37: 521–529.
Publication types
MeSH terms
LinkOut - more resources
Full Text Sources
Other Literature Sources

