. 2013 Jul;94(Pt 7):1597-1607.
doi: 10.1099/vir.0.050914-0. Epub 2013 Mar 27.

L74V increases the reverse transcriptase content of HIV-1 virions with non-nucleoside reverse transcriptase drug-resistant mutations L100I+K103N and K101E+G190S, which results in increased fitness

Affiliations

L74V increases the reverse transcriptase content of HIV-1 virions with non-nucleoside reverse transcriptase drug-resistant mutations L100I+K103N and K101E+G190S, which results in increased fitness

Jiong Wang et al. J Gen Virol. 2013 Jul.

Abstract

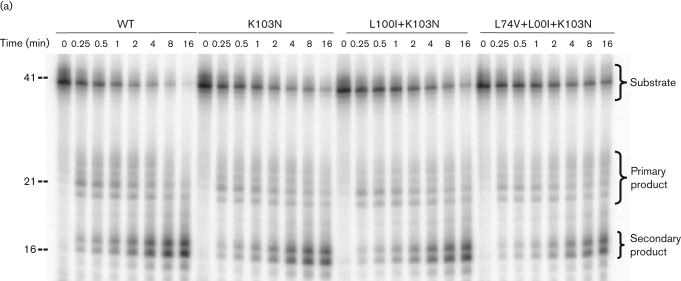
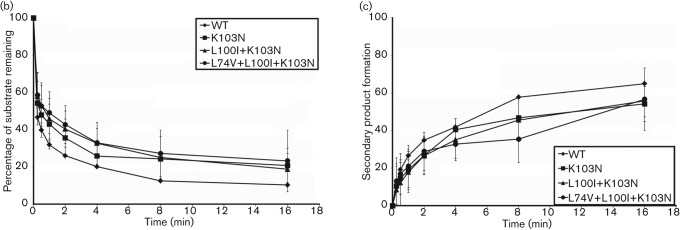
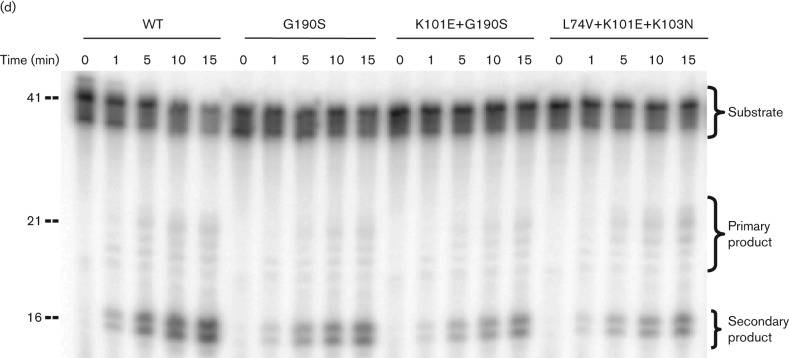
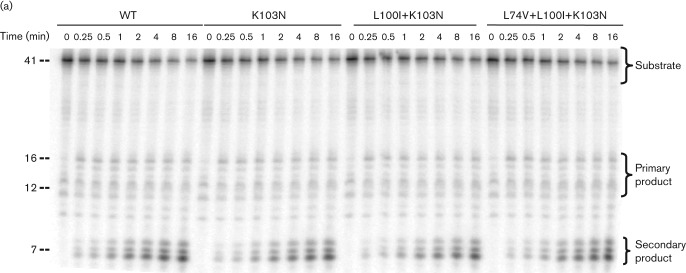
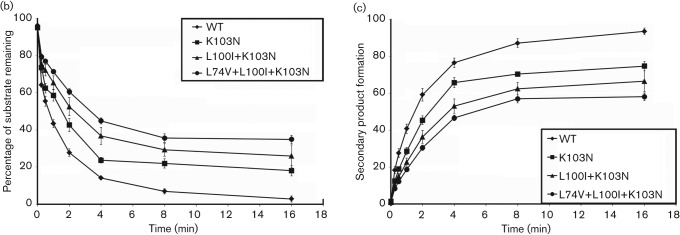
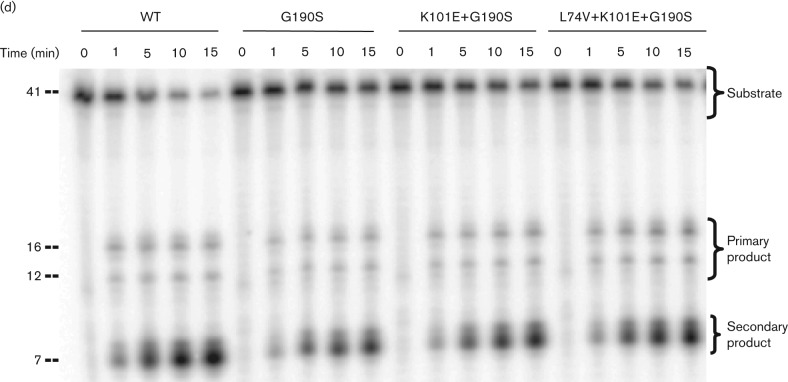
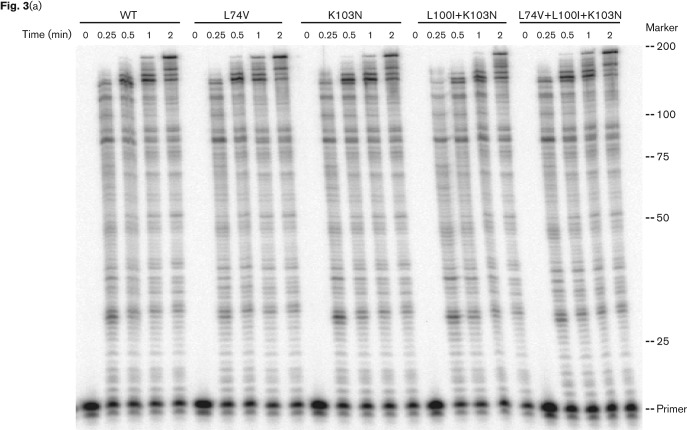
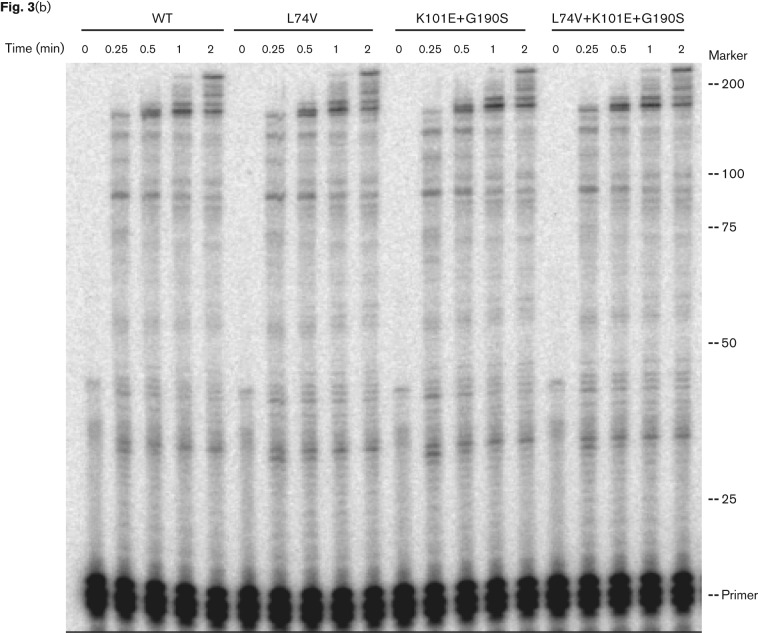
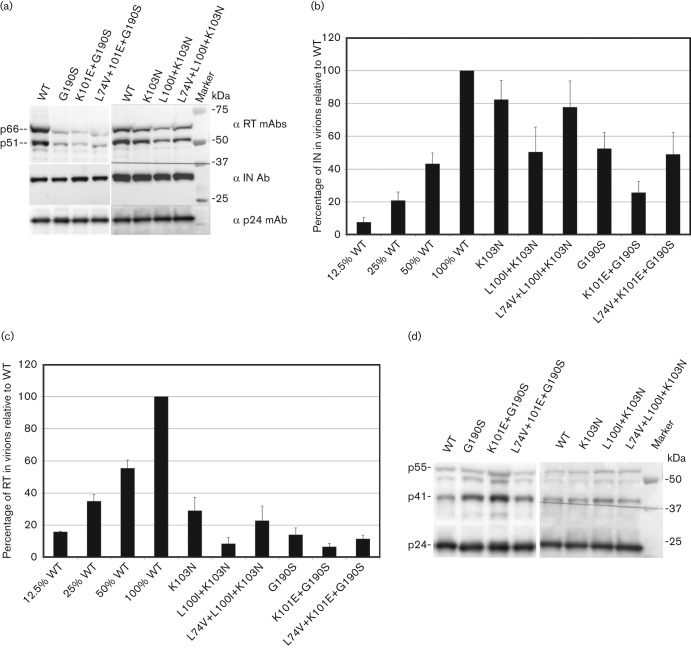
The fitness of non-nucleoside reverse transcriptase inhibitor (NNRTI) drug-resistant reverse transcriptase (RT) mutants of HIV-1 correlates with the amount of RT in the virions and the RNase H activity of the RT. We wanted to understand the mechanism by which secondary NNRTI-resistance mutations, L100I and K101E, and the nucleoside resistance mutation, L74V, alter the fitness of K103N and G190S viruses. We measured the amount of RT in virions and the polymerization and RNase H activities of mutant RTs compared to wild-type, K103N and G190S. We found that L100I, K101E and L74V did not change the polymerization or RNase H activities of K103N or G190S RTs. However, L100I and K101E reduced the amount of RT in the virions and subsequent addition of L74V restored RT levels back to those of G190S or K103N alone. We conclude that fitness changes caused by L100I, K101E and L74V derive from their effects on RT content.


Figures

Fig. 1.
Fig. 1.
Polymerase-dependent RNase H activity of recombinant WT and mutant RTs. (a, d) Representative polyacrylamide gel of DNA 3′ end-directed RNase H activity. The substrate used was made by annealing a 26 nt long DNA oligonucleotide primer to a 5′ end-labelled 41 nt long RNA such that the 3′ end of the DNA primer was recessed relative to the RNA 5′ end. Reactions were allowed to proceed for the indicated lengths of time. Nucleotide size markers are indicated on the left. (b, e) Rate of total substrate degradation (y-axis) versus time (x-axis). (c, f) Rate of secondary product formation (y-axis) versus time (x-axis). The ratio of secondary cleavage products to the sum of the total products were quantified by phosphorimaging and plotted on the y-axis versus time on the x-axis. The reactions were performed in triplicate using a single protein prep for each mutant. Results represent the means and standard deviations of three replicates. Bonferroni adjusted P-values were calculated using a t-test. The amount of substrate remaining or of product formed at 15 min for G190S was statistically different to WT (P<0.0001).
Fig. 1.
Fig. 1.
Polymerase-dependent RNase H activity of recombinant WT and mutant RTs. (a, d) Representative polyacrylamide gel of DNA 3′ end-directed RNase H activity. The substrate used was made by annealing a 26 nt long DNA oligonucleotide primer to a 5′ end-labelled 41 nt long RNA such that the 3′ end of the DNA primer was recessed relative to the RNA 5′ end. Reactions were allowed to proceed for the indicated lengths of time. Nucleotide size markers are indicated on the left. (b, e) Rate of total substrate degradation (y-axis) versus time (x-axis). (c, f) Rate of secondary product formation (y-axis) versus time (x-axis). The ratio of secondary cleavage products to the sum of the total products were quantified by phosphorimaging and plotted on the y-axis versus time on the x-axis. The reactions were performed in triplicate using a single protein prep for each mutant. Results represent the means and standard deviations of three replicates. Bonferroni adjusted P-values were calculated using a t-test. The amount of substrate remaining or of product formed at 15 min for G190S was statistically different to WT (P<0.0001).
Fig. 2.
Fig. 2.
Polymerase-independent RNase H activity of purified WT and mutant RTs. (a, d) Representative polyacrylamide gel of RNA 5′-end-directed RNase H activity. The substrate used was made by annealing a 5′-end-labelled 41 nt RNA to a 77 nt DNA primer such that the 5′ end of the RNA was recessed relative to the DNA. The reactions were allowed to proceed for the indicated lengths of time. Nucleotide size markers are indicated on the left. (b, e) Rate of total substrate degradation (y-axis) versus time (x-axis). (c, f) Rate of secondary product formation (y-axis) versus time (x-axis). The ratio of secondary cleavage products to the sum of the total products were quantified by phosphorimaging and plotted on the y-axis versus time on the x-axis. The reactions were performed in triplicate using a single protein prep for each mutant. Results represent the means and standard deviations of three replicates. Bonferroni adjusted significant differences in the amount of substrate remaining or product formed at 15 min compared to WT were calculated using a t-test.
Fig. 2.
Fig. 2.
Polymerase-independent RNase H activity of purified WT and mutant RTs. (a, d) Representative polyacrylamide gel of RNA 5′-end-directed RNase H activity. The substrate used was made by annealing a 5′-end-labelled 41 nt RNA to a 77 nt DNA primer such that the 5′ end of the RNA was recessed relative to the DNA. The reactions were allowed to proceed for the indicated lengths of time. Nucleotide size markers are indicated on the left. (b, e) Rate of total substrate degradation (y-axis) versus time (x-axis). (c, f) Rate of secondary product formation (y-axis) versus time (x-axis). The ratio of secondary cleavage products to the sum of the total products were quantified by phosphorimaging and plotted on the y-axis versus time on the x-axis. The reactions were performed in triplicate using a single protein prep for each mutant. Results represent the means and standard deviations of three replicates. Bonferroni adjusted significant differences in the amount of substrate remaining or product formed at 15 min compared to WT were calculated using a t-test.
Fig. 3.
Fig. 3.
RNA-dependent DNA polymerization activity of purified WT and mutant RTs. (a, b) Representative polyacrylamide gel of the RNA-dependent DNA polymerization activity of WT and mutant RTs using a DNA primer. The substrate used was made by annealing a 5′ end-labelled PBS DNA primer (26 nt) to the RNA template D199 (RNA containing +1 to +199 of the NL4-3 HIV-1 genomic sequence). Reactions were allowed to proceed for the indicated lengths of time. Nucleotide markers are indicated on the right. Equal amounts of specific activity units of RT as measured by poly(rA)/oligo(dT) template/primer synthesis were used per reaction.
Fig. 3.
Fig. 3.
RNA-dependent DNA polymerization activity of purified WT and mutant RTs. (a, b) Representative polyacrylamide gel of the RNA-dependent DNA polymerization activity of WT and mutant RTs using a DNA primer. The substrate used was made by annealing a 5′ end-labelled PBS DNA primer (26 nt) to the RNA template D199 (RNA containing +1 to +199 of the NL4-3 HIV-1 genomic sequence). Reactions were allowed to proceed for the indicated lengths of time. Nucleotide markers are indicated on the right. Equal amounts of specific activity units of RT as measured by poly(rA)/oligo(dT) template/primer synthesis were used per reaction.
Fig. 4.
Fig. 4.
Western blot showing the relative amounts of RT in WT and mutant virions. The G190S proteins were run on separate gels than the K103N proteins. Each gel was stripped and reprobed for RT, IN and p24 quantitations. (a) Representative Western blot probed with antibodies that recognized HIV-1 RT p66 and p51 subunits, IN, or Gag capsid p24 protein. Virus stocks were prepared by transfecting 293 cells with either WT or mutant plasmid DNA. Mutant virus pellets were prepared with an equal amount (200 ng) of capsid protein. (b) Relative amounts of IN for each mutant compared to WT as percentages on the y-axis. The bars represent the means and standard deviations of triplicate Western blots. Bonferroni adjusted P-values were calculated using one way ANOVA. WT vs mutants P<0.01; L100I+K103N vs K103N P<0.01; K101E+G190S vs G190S P<0.01 (c) Relative amounts of RT for each mutant compared to WT as percentages on the y-axis. The bars represent the means and standard deviations of triplicate Western blots. Bonferroni adjusted P-values were calculated using one way ANOVA. L100I+K103N vs K103N P = 0.0014; K101E+G190S vs G190S P = 0.0041; L74V+L100I+K103N vs L100I+K103N P = 0.0201; L74V+K101E+G190S vs K101E+G190S P = 0.0408. (d) Representative Western blot of the relative amounts of Gag processing intermediates. Equal amounts of p24 capsid protein were loaded for each virus (200 ng). The molecular masses in kilodaltons of the markers are shown on the right side.

Similar articles

Cited by

References

    1. Amacker M., Hübscher U. (1998). Chimeric HIV-1 and feline immunodeficiency virus reverse transcriptases: critical role of the p51 subunit in the structural integrity of heterodimeric lentiviral DNA polymerases. J Mol Biol 278, 757–765 10.1006/jmbi.1998.1739 - DOI - PubMed
    1. Archer R. H., Dykes C., Gerondelis P., Lloyd A., Fay P., Reichman R. C., Bambara R. A., Demeter L. M. (2000). Mutants of human immunodeficiency virus type 1 (HIV-1) reverse transcriptase resistant to nonnucleoside reverse transcriptase inhibitors demonstrate altered rates of RNase H cleavage that correlate with HIV-1 replication fitness in cell culture. J Virol 74, 8390–8401 10.1128/JVI.74.18.8390-8401.2000 - DOI - PMC - PubMed
    1. Aulicino P. C., Rocco C. A., Mecikovsky D., Bologna R., Mangano A., Sen L. (2010). HIV type-1 genotypic resistance profiles in vertically infected patients from Argentina reveal an association between K103N+L100I and L74V mutations. Antivir Ther 15, 641–650 10.3851/IMP1571 - DOI - PubMed
    1. Bacheler L. T., Anton E. D., Kudish P., Baker D., Bunville J., Krakowski K., Bolling L., Aujay M., Wang X. V. & other authors (2000). Human immunodeficiency virus type 1 mutations selected in patients failing efavirenz combination therapy. Antimicrob Agents Chemother 44, 2475–2484 10.1128/AAC.44.9.2475-2484.2000 - DOI - PMC - PubMed
    1. Bacheler L., Jeffrey S., Hanna G., D’Aquila R., Wallace L., Logue K., Cordova B., Hertogs K., Larder B. & other authors (2001). Genotypic correlates of phenotypic resistance to efavirenz in virus isolates from patients failing nonnucleoside reverse transcriptase inhibitor therapy. J Virol 75, 4999–5008 10.1128/JVI.75.11.4999-5008.2001 - DOI - PMC - PubMed

Publication types

MeSH terms

LinkOut - more resources